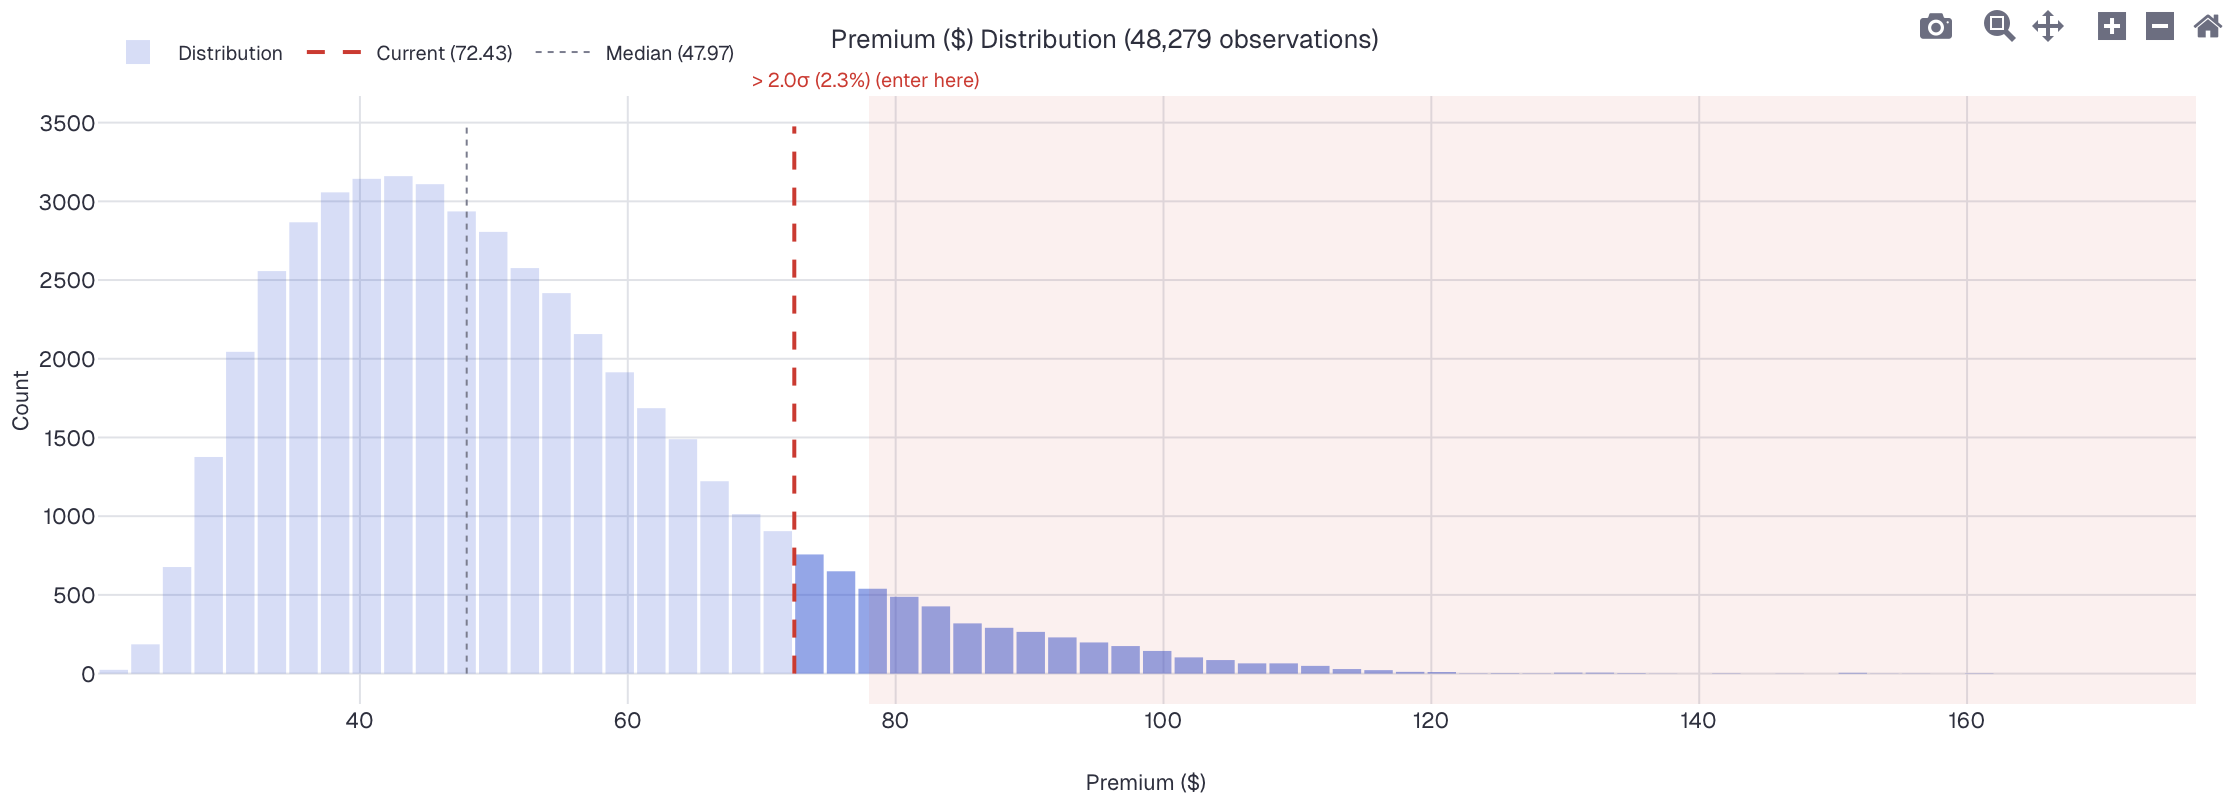
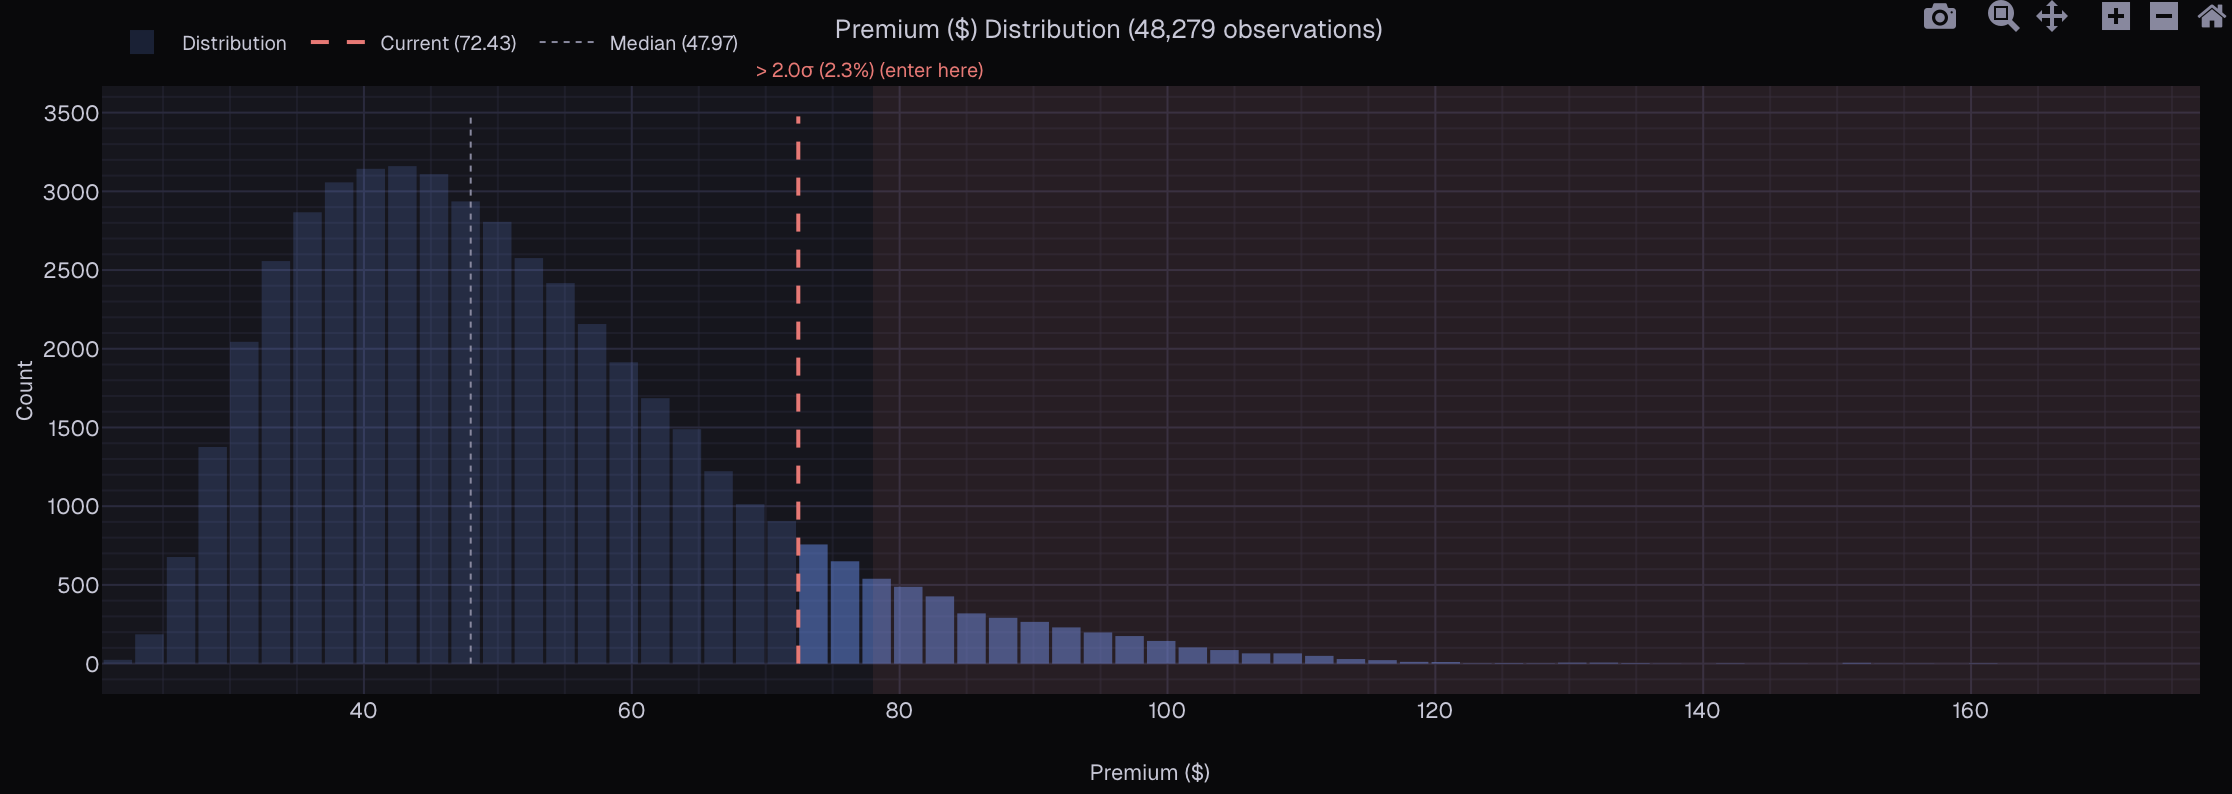
Accurate measurement based on institutional-grade vol pricing, systematic research, and historical simulation — built for options traders who care about getting the details right.
A vol surface built on wrong assumptions contaminates every price, every greek, every backtest downstream. Getting the measurement right is the foundation.
Compare every symbol's vol, skew, and term structure against its own history and against other names right now. Scan across both time and product space.
An idea that looks compelling today may have failed in every regime that matters. Test it historically, prove it works — then size into it.
Not a prettier version of what you already have. A fundamentally more accurate foundation for options analysis.
SPY, AAPL, QQQ, and every equity option you trade is American-style — meaning early exercise changes what the option is actually worth. Most platforms ignore this and use Black-Scholes. We use a trinomial tree pricer that accounts for early exercise, discrete dividends, and implied borrow rates. The result: call IVs and put IVs that actually match at the same strike.
Earnings analysis — implied vs. actual moves and IV trajectory around each event, built on properly fitted vol surfaces.
A single IV number doesn't tell you much. OptionSpace fits smooth, bid-ask-weighted vol curves across every expiration — giving you a complete picture of the vol surface. Compare smiles across expirations, watch how the surface evolves intraday, and measure skew with precision.
Four expirations overlaid — from short-dated (steep) to longer-dated (flatter). The term structure tells you how the market prices risk at each horizon.
Implied vol is what the market expects. Realized vol is what actually happened. The gap between them — the vol risk premium — is one of the most durable edges in options trading. OptionSpace computes realized vol from 385 intraday returns per day and lets you compare it against IV at any tenor across 14 years of history.
NVDA implied vol (red) vs. realized vol (blue). When the gap is wide, options are expensive relative to actual movement.
Vol Screener, Vol Premium, Skew Scanner, and Earnings Vol analysis — four tools that scan across every symbol simultaneously and rank opportunities by how unusual the current environment is relative to its own history. Find what's cheap, what's overpriced, and what's extreme before it becomes obvious.
Every symbol plotted by IV percentile (x) vs. skewness (y). Red = historically extreme and worth investigating.
An idea isn't an edge. Knowing your idea would have made money — across years of real market conditions — is. Simulate any vol structure historically using actual bid-ask prices and fitted vol surfaces. Test it through earnings, rate shocks, and quiet markets. If it doesn't hold up, it's not a strategy. It's a guess.
PnL vs. entry signal strength — green dots are winners, red are losers. The edge becomes clearer as the signal gets stronger.
Forget predicting the market. Most trading firms can't even accurately measure where the options market is right now. There's a meaningful difference between trading on a view and trading on a process — one can be right once, the other can be right consistently.
Most platforms get the fundamentals wrong before you even start analyzing. We use a trinomial tree pricer with early exercise, discrete dividends, and implied borrow. The result: calls and puts agree at every strike.
Scan across time and product space simultaneously. Compare every symbol's vol, skew, and term structure against its own history and against the rest of the market right now. The best ideas only surface when you see the full landscape.
An observation isn't an edge. Simulate it historically using actual bid-ask prices and fitted vol surfaces. If it doesn't hold up across different regimes, don't bet on it.
Where does today's premium sit in the full distribution? 48,000+ historical observations tell you whether this is normal or an opportunity.
Everything is included at each tier.
The complete toolkit for traders who take vol seriously.
billed annually
$149/month billed monthly
For traders who want to see the surface in motion, not just at the close.
billed annually
$299/month billed monthly
Institutional-grade infrastructure, compliance, and support for fund operations.
billed annually
Looking for the underlying data rather than the dashboards? We're preparing access to historical fitted vol surfaces — cleaned, arbitrage-free, ready for research — and SPX implied discount factors: the actual cost of carry baked into SPX options by market makers, not Fed Funds or SOFR.
Get in touch →Commercial use means incorporating OptionSpace data or analysis into your fund's investment process, using it in client-facing communications, or building it into internal systems that support trading decisions. Personal analysis — even if you're a professional trader managing your own capital — falls under Trader or Pro. Not sure? Email us.
Cancel anytime from your account settings. Your subscription won't auto-renew at the end of the current billing cycle, and you keep full access until then.
Measure accurately. Research systematically. Simulate before you trade. Start exploring for free.
Launch App