Why Pricing Matters

Most options platforms use Black-Scholes with a flat risk-free rate and spot as the forward price. This ignores dividends, borrow costs, and early exercise. The result: your call and put implied vols don't match, your greeks are wrong, and your backtests are built on bad data.

Here's what that looks like, compared to getting it right.

How to Read These Charts

Each chart below shows two panels side by side. Same market data, same day, same options — the only difference is the model.

Left Panel: Typical Platform

Uses spot price as the forward and a flat SOFR rate (4.58%). This is what most retail platforms do. No dividend adjustment, no implied borrow, no rate term structure.

Right Panel: OptionSpace

Implies the forward from put-call parity, uses implied rate curves from the options market, and models dividends as discrete cash payments. American vol pricing with early exercise.

On each panel, blue dots are call IVs and red dots are put IVs at each strike. The vertical bars show the bid/ask spread in vol space — the range of implied vols between the bid and ask price. The yellow line is the fitted vol curve that the platform uses for pricing and greeks.

The key test: at any given strike, a call and a put should have the same implied volatility. If they don't, the model's forward is wrong.

All charts below use SPY options data from November 10, 2025 — a typical Monday with no unusual market events. The same patterns appear on any trading day and for any American-exercise stock (AAPL, NVDA, QQQ, etc.).

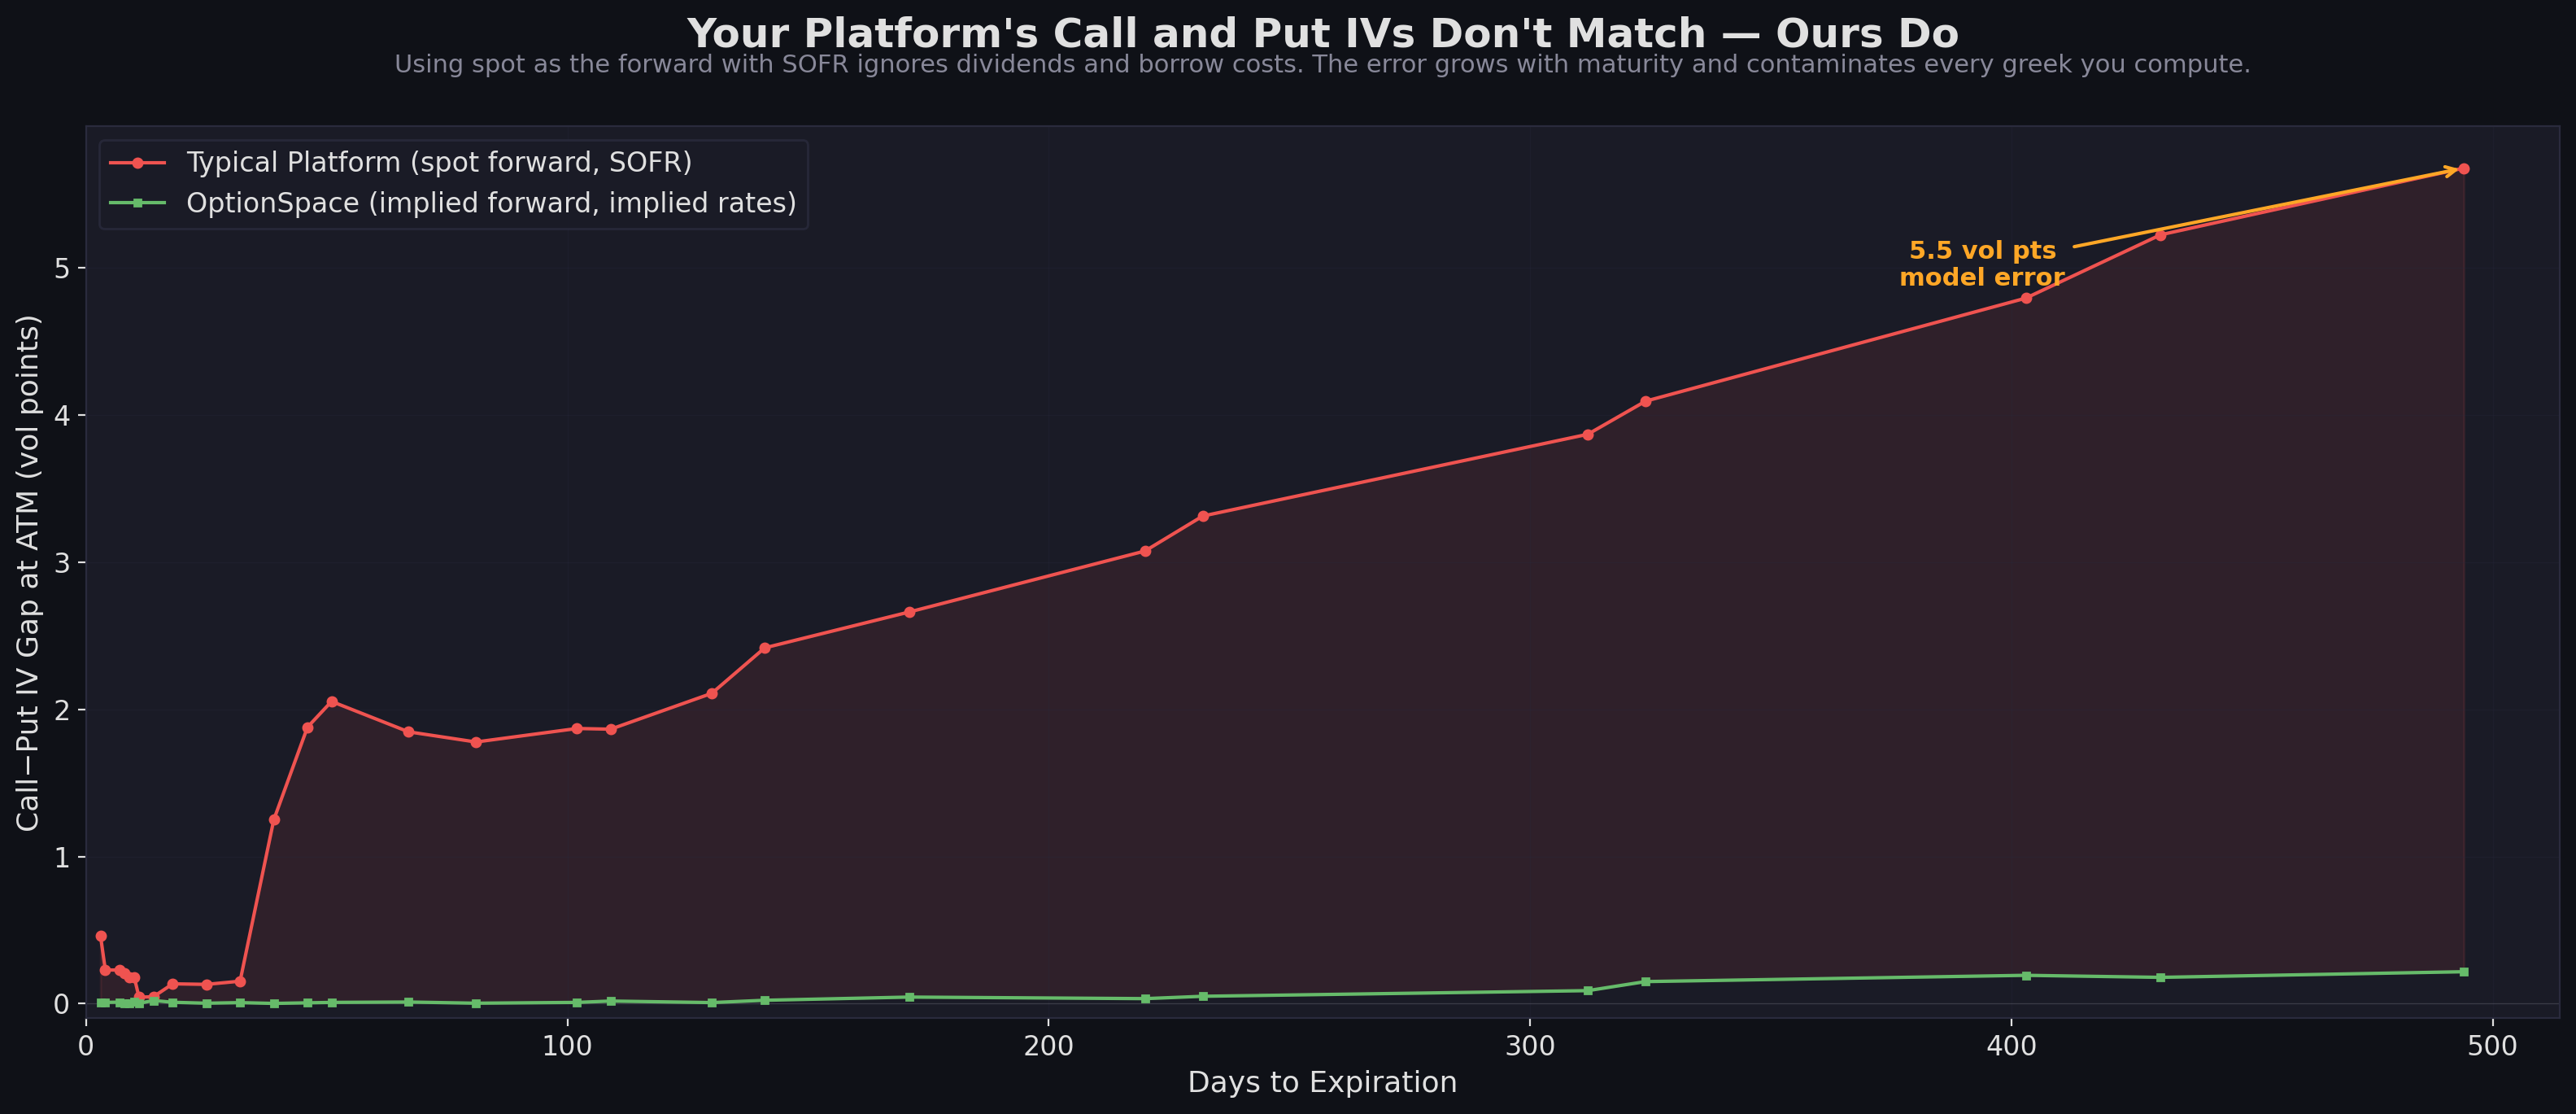
1 Day to Expiry: The Error Is Already There

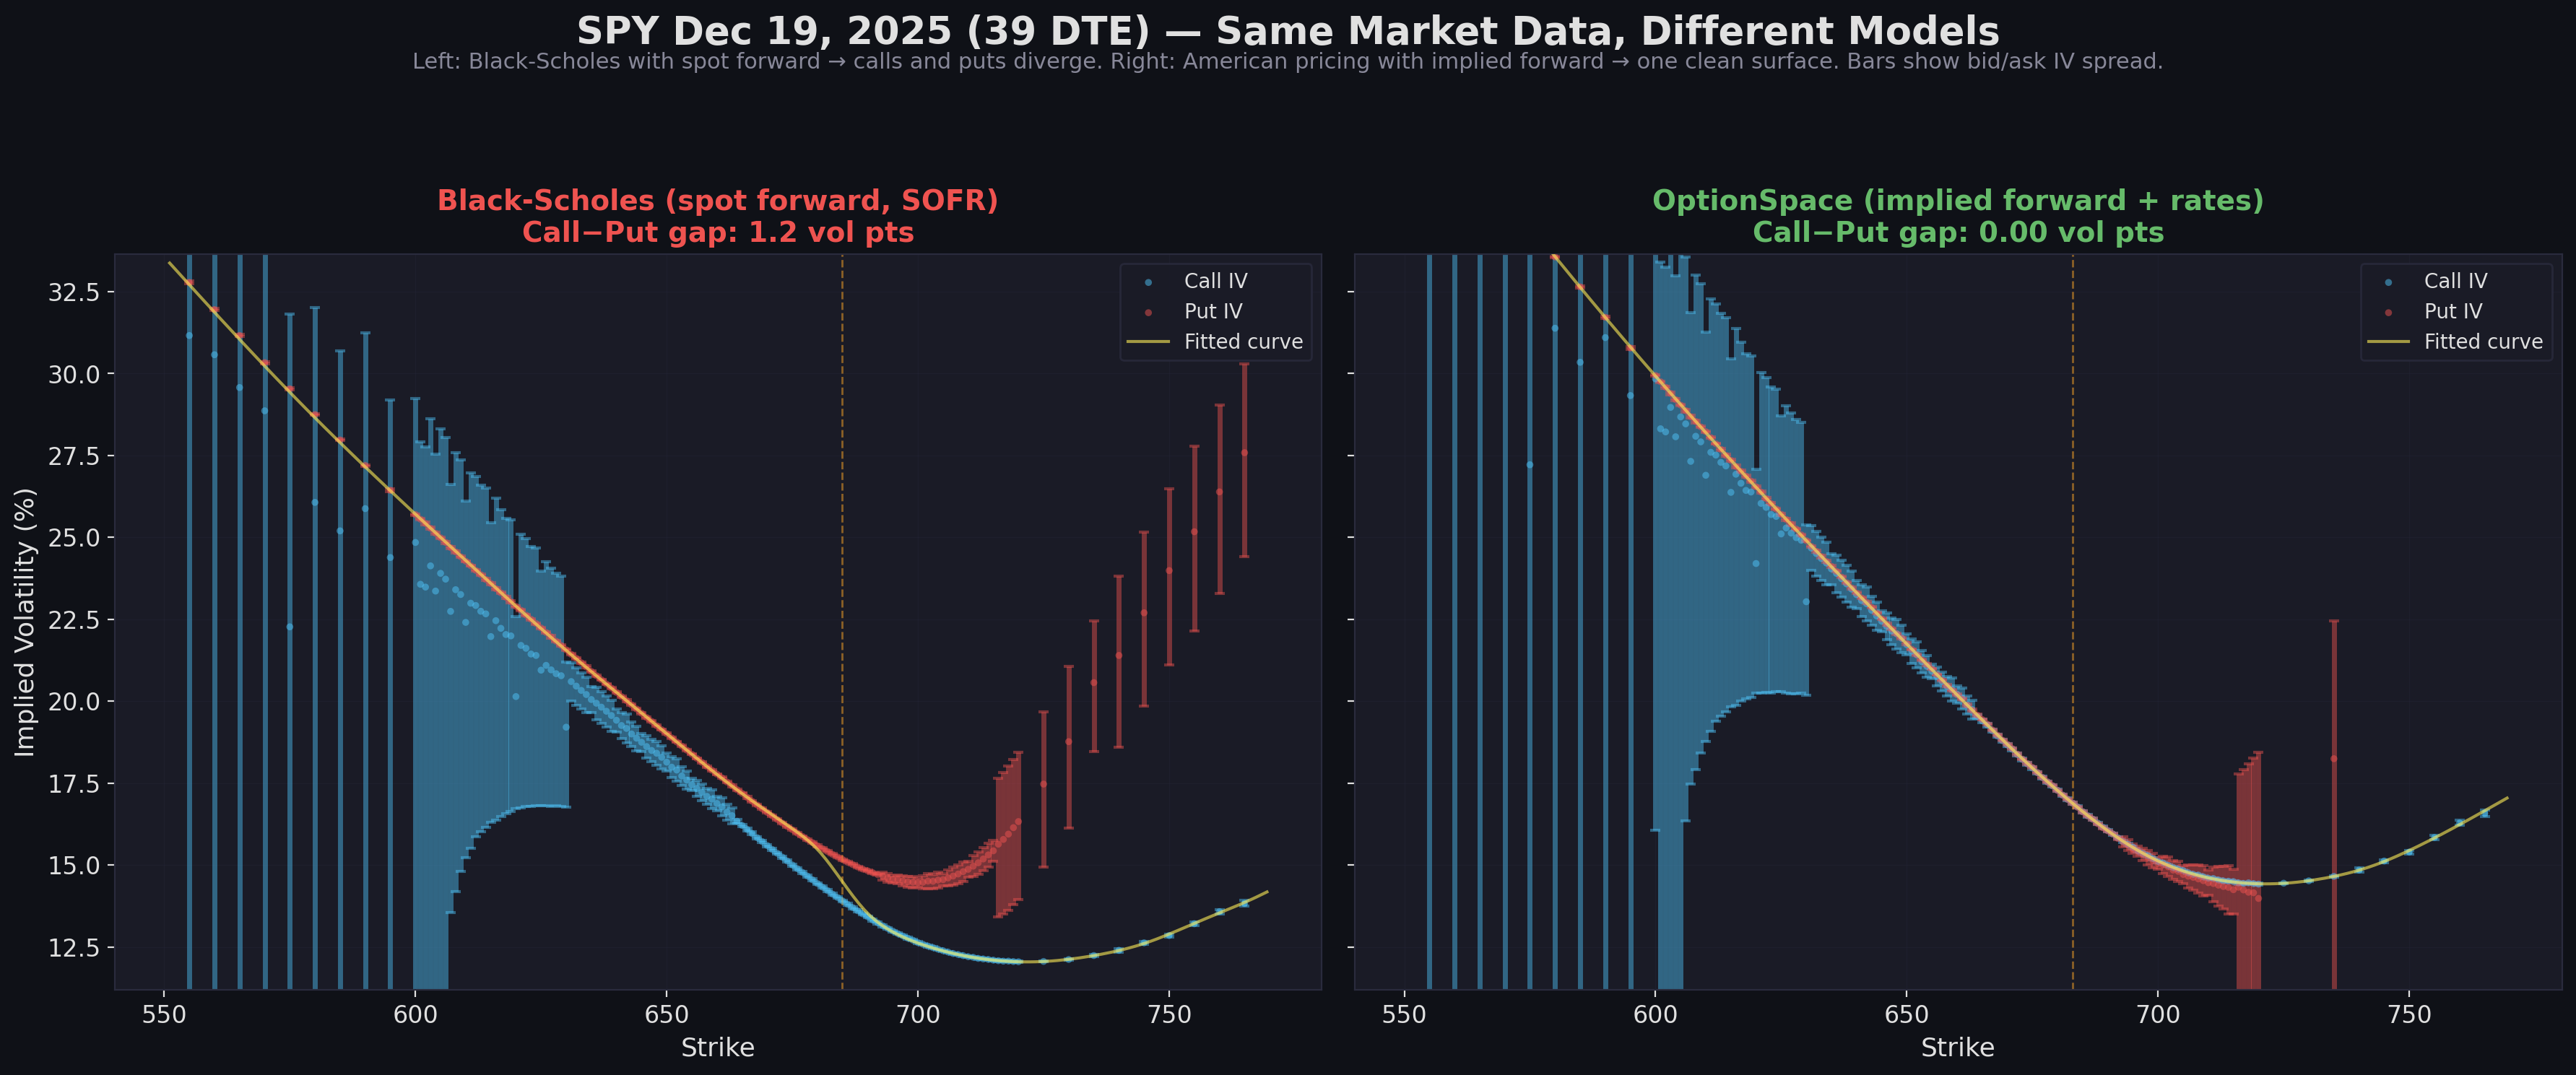
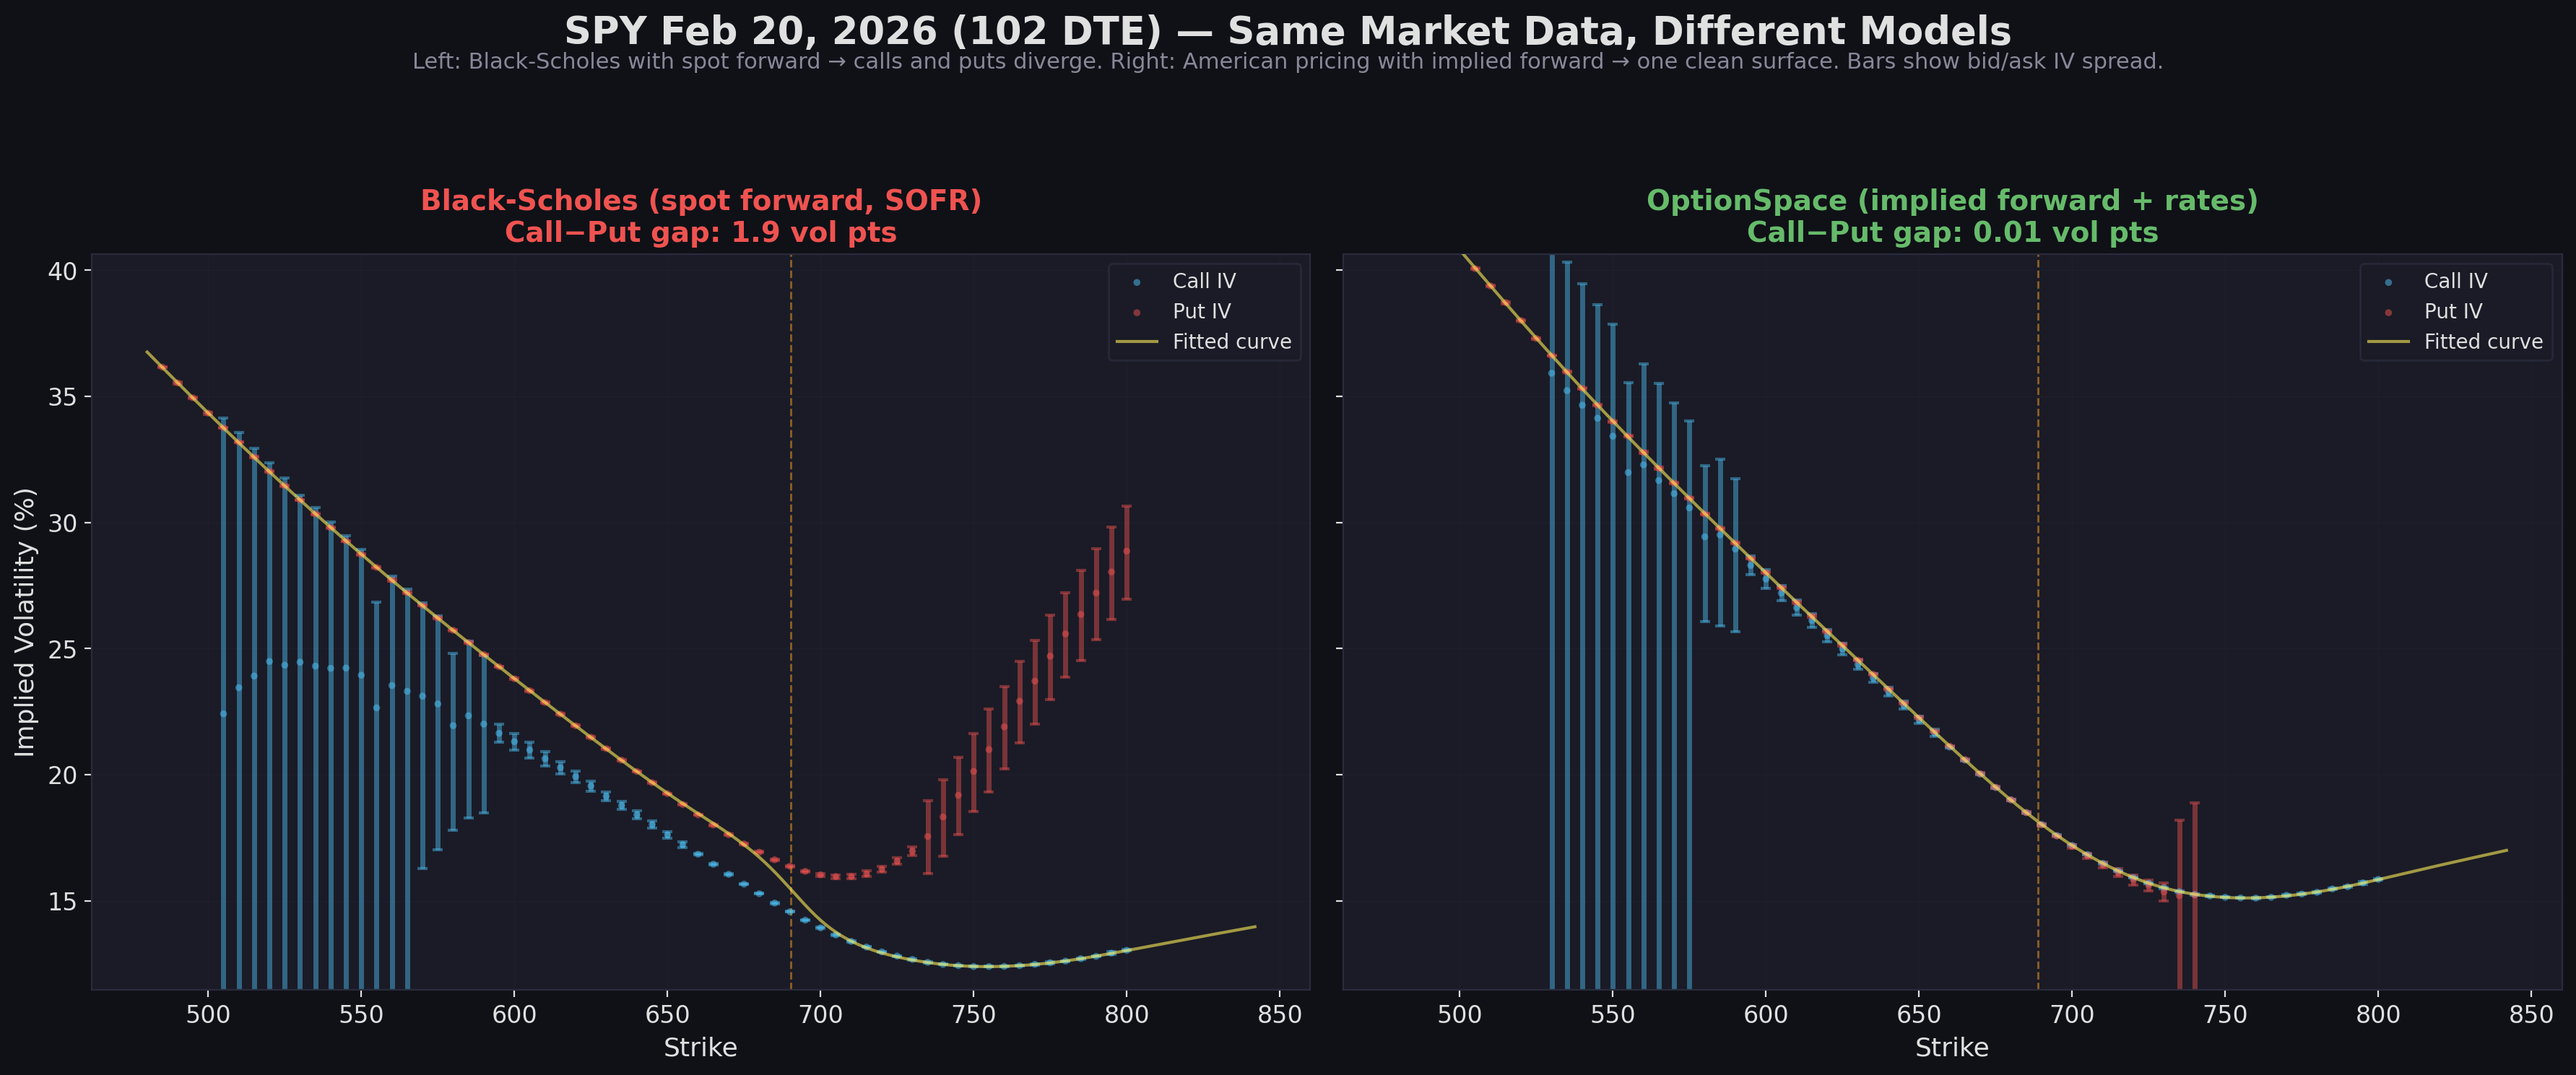
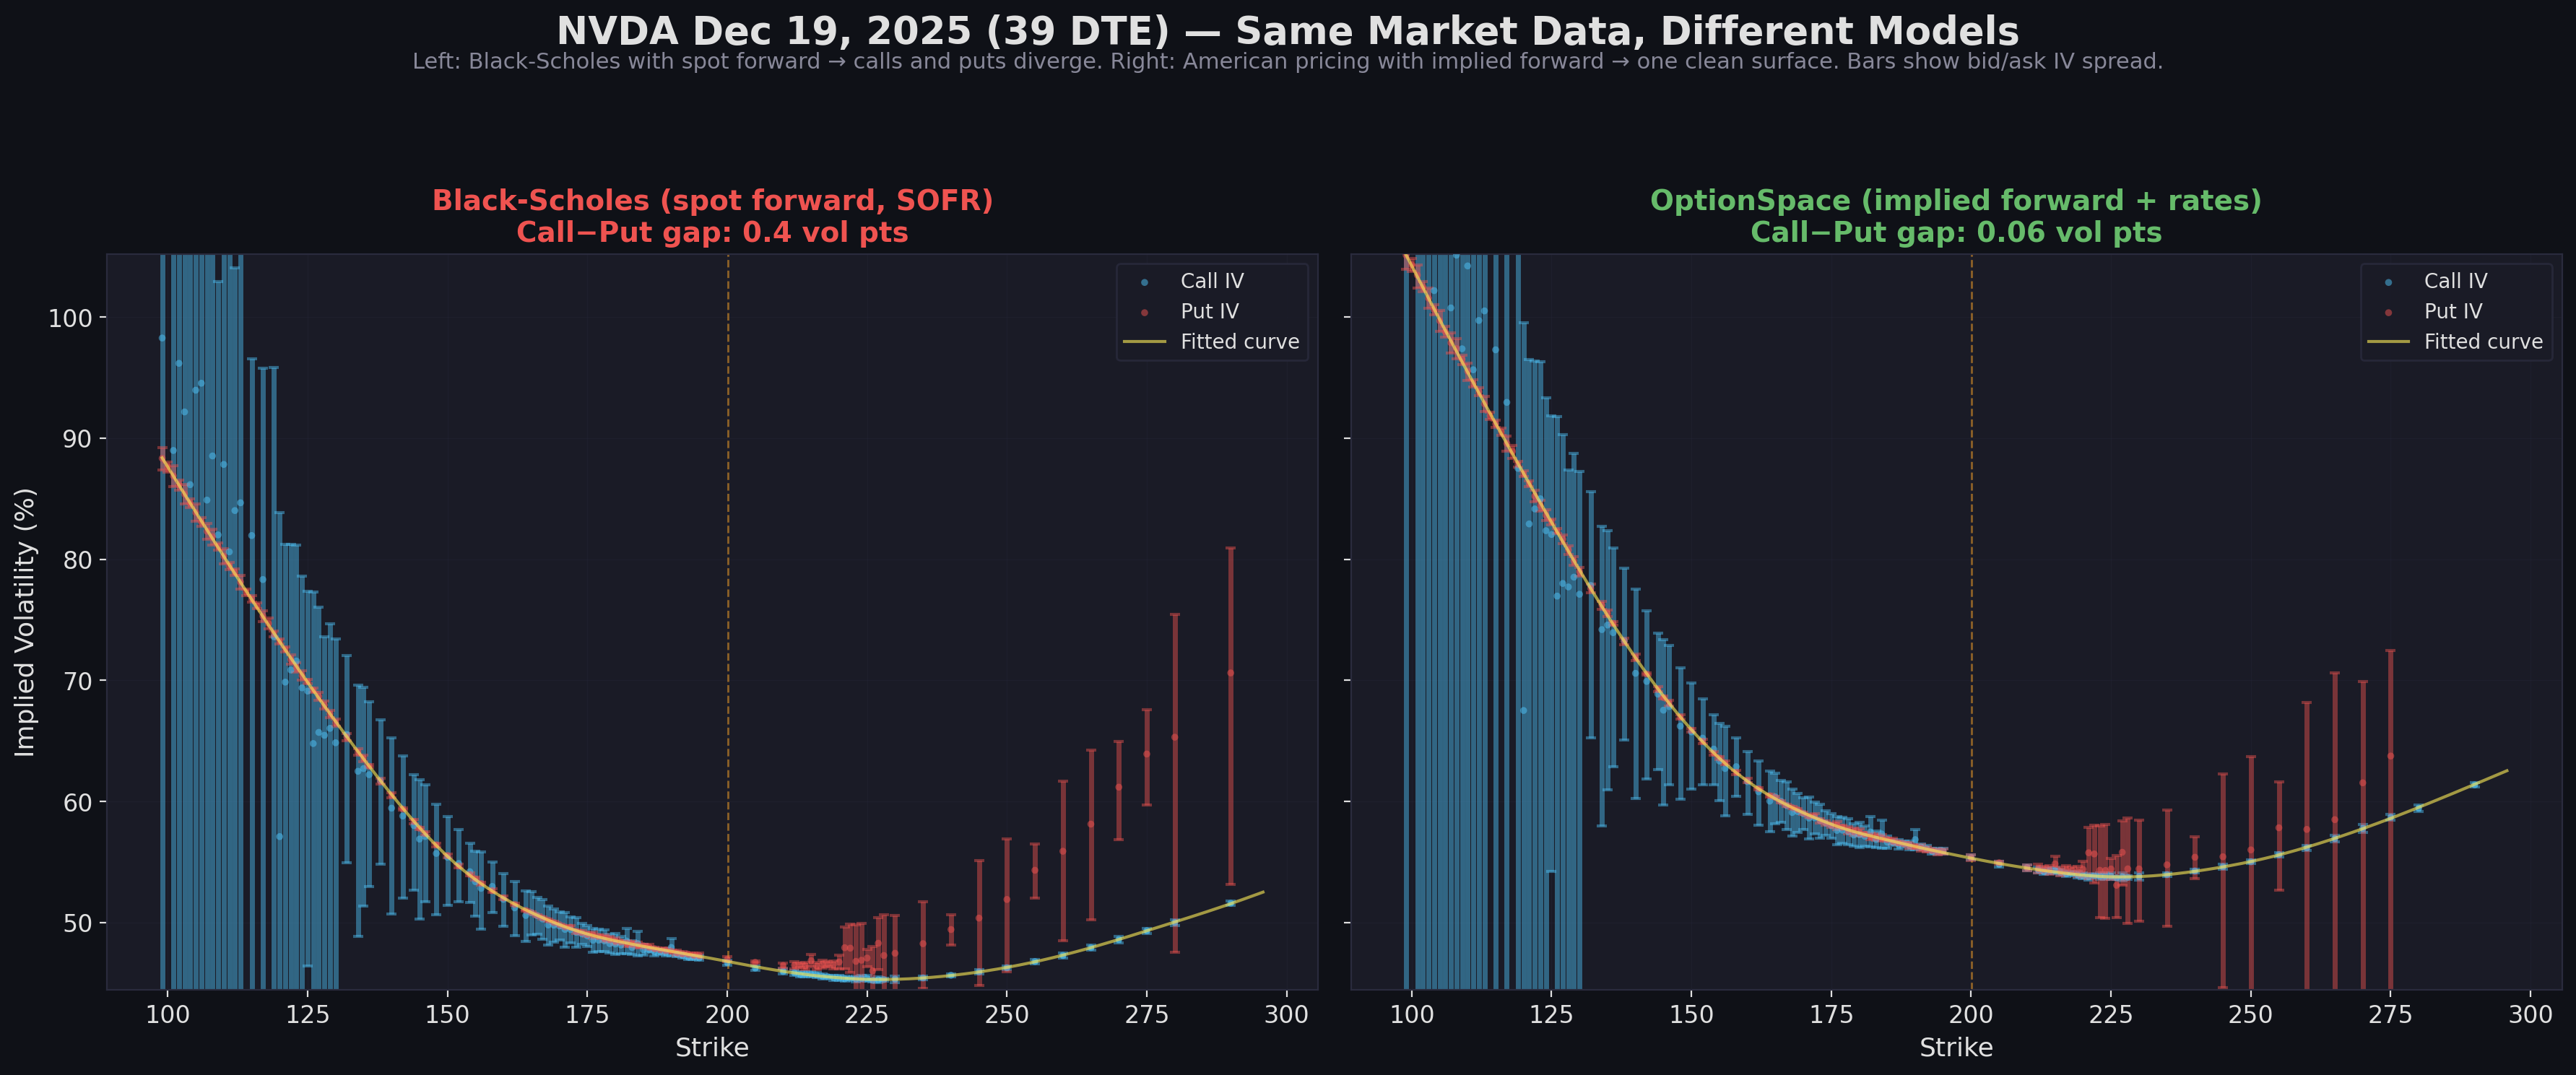
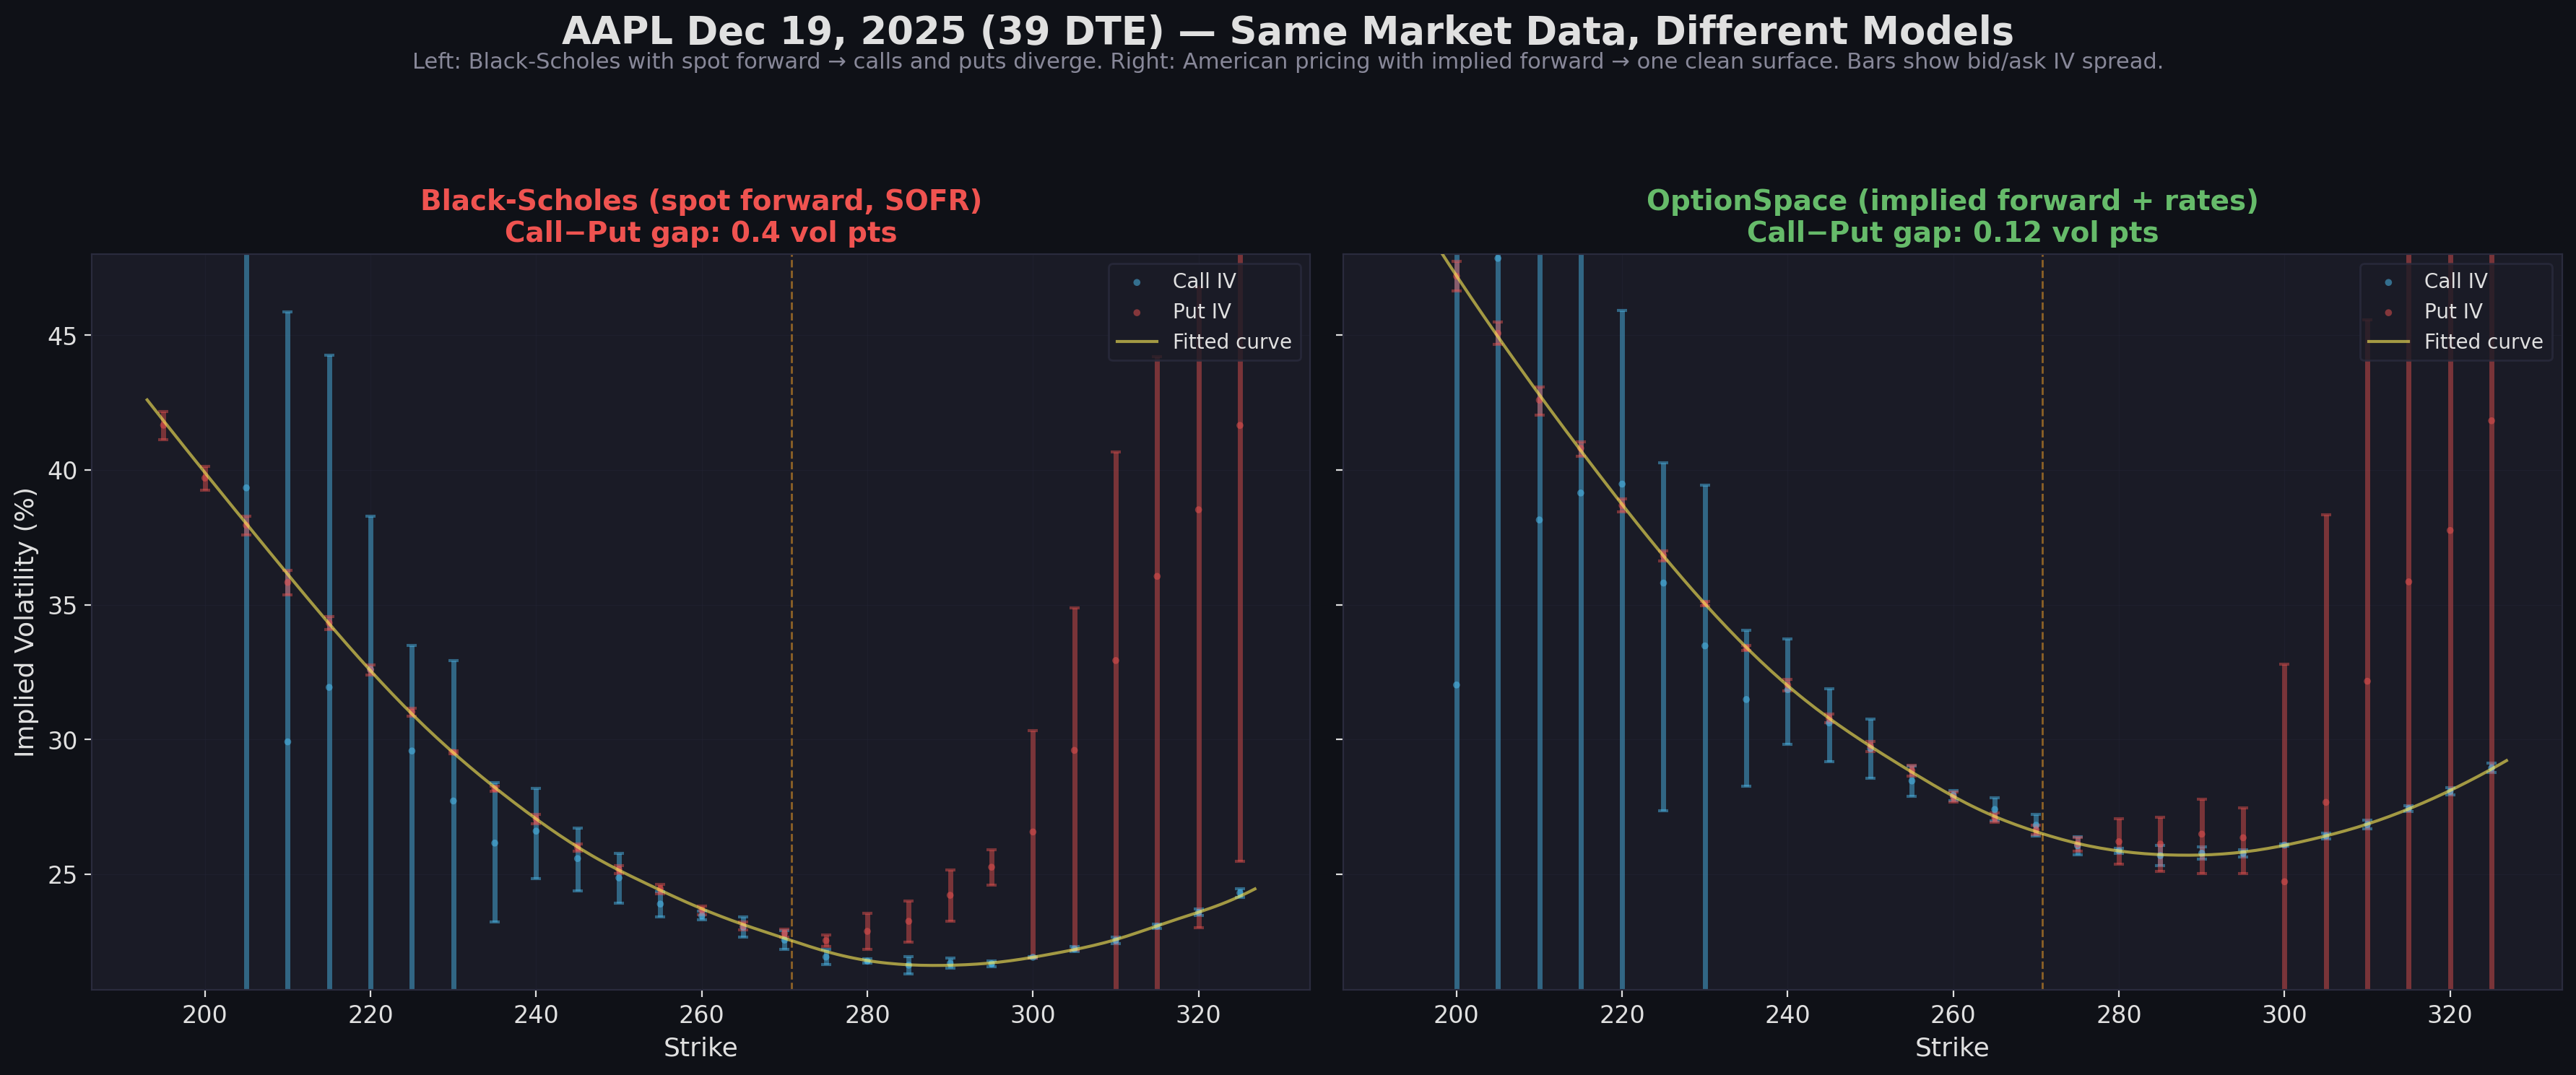
Even for a 1 DTE option, using spot as the forward with a flat rate creates a measurable call/put divergence. The blue dots (calls) and red dots (puts) should overlap — but on the left panel, they're separated by over 2 vol points.

1 DTE vol smile comparison
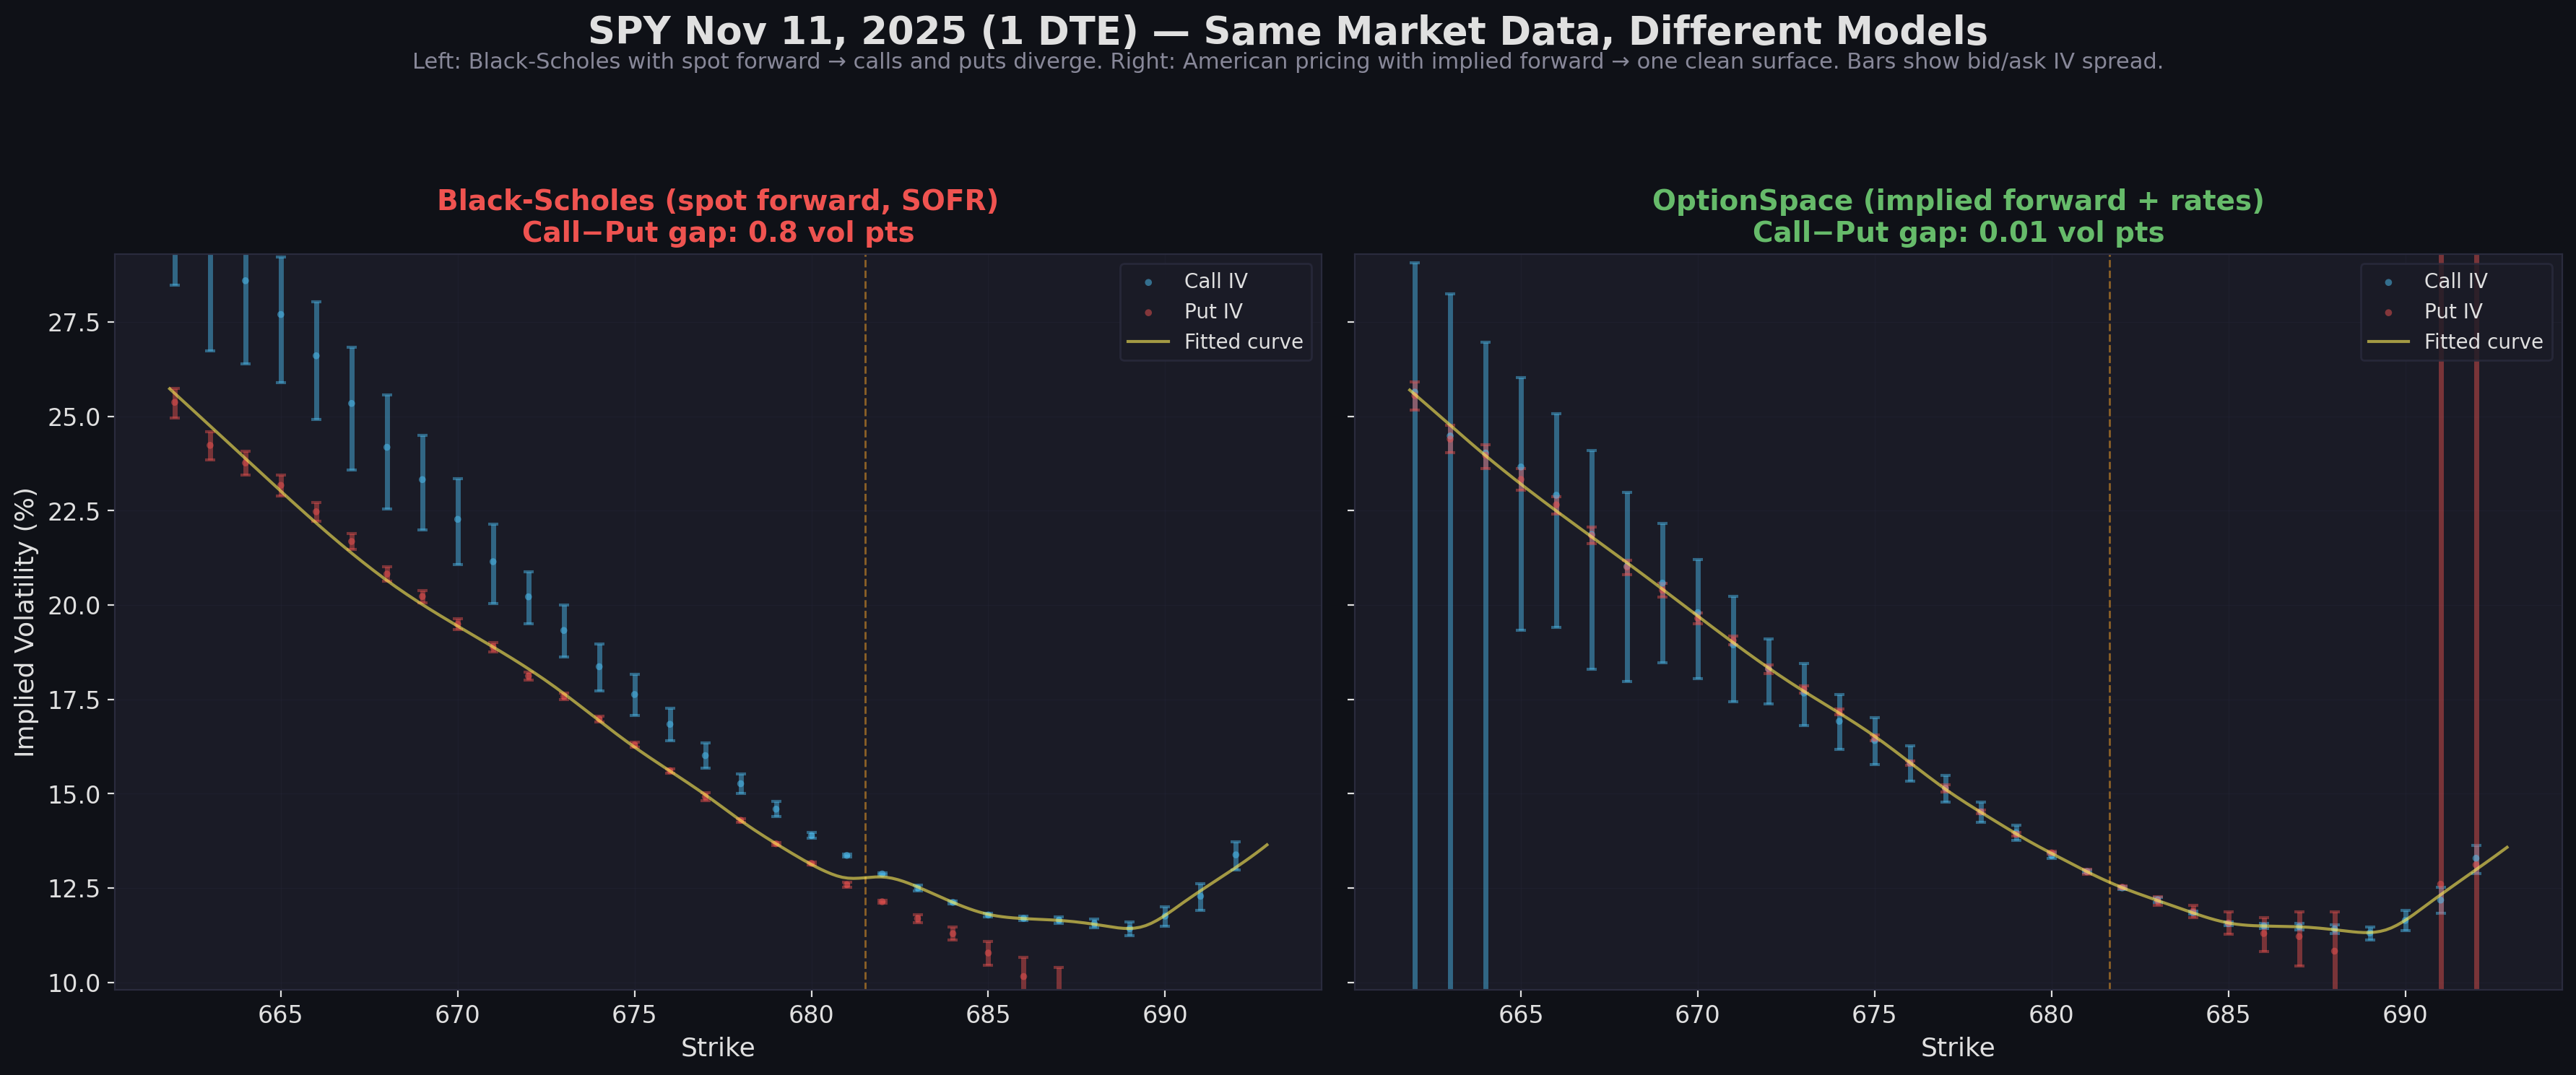
Left: 2.3 vol point gap. The averaged curve compromises between calls and puts — fitting neither correctly.
Right: 0.01 vol point gap. Calls and puts overlap within their bid/ask spread. One clean curve fits both.

39 DTE: Dividends Break Naive Pricing

SPY pays a ~$2 dividend every quarter. December 19 is the Q4 ex-dividend date, and this expiry lands right after it. This is generally the hardest expiry to price correctly, and where naive models fail the worst.

A model using spot + SOFR doesn't know about dividends at all. The $2 dividend translates directly into a forward pricing error, which shows up as a persistent call/put IV gap.

39 DTE vol smile with dividend
Left: 1.2 vol point gap from ignoring the $2 dividend. The curve can't fit both calls and puts, so every greek derived from it is wrong.
Right: 0.00 vol point gap. Our model implies the forward from the market, automatically capturing the dividend's effect.

102 DTE: The Error Compounds

At 102 days to expiry, the naive model has accumulated multiple dividend misses and rate curve errors. The call/put divergence is nearly 2 vol points — clearly visible to anyone looking at a vol surface.

102 DTE vol smile comparison
What this means for you: If you're backtesting a strategy on 3-month options, every entry and exit price in your backtest is wrong by the amount this curve is off. If you're hedging with deltas from this surface, your hedge ratios are systematically biased. The error isn't random — it's a consistent directional bias.

It's Not Just SPY

Every American-exercise option has this problem. Here's the same comparison for NVDA and AAPL at 39 DTE. Even without a dividend on this specific expiry, the naive model's use of spot instead of an implied forward — combined with ignoring borrow costs and early exercise — creates a persistent call/put gap.

NVDA 39 DTE vol smile comparison
NVDA: Naive gap of 0.4 vol pts vs our 0.06. The gap here comes from the wrong forward and ignoring borrow costs — it grows for longer-dated options where these errors compound.
AAPL 39 DTE vol smile comparison
AAPL: Naive gap of 0.4 vol pts vs our 0.12. AAPL's quarterly dividend is small (~$0.25), but combined with early exercise and borrow costs, the naive model's call/put divergence propagates to every greek.

The Problem Grows With Maturity

Here's the ATM call/put IV gap across every available expiry, from 1 day to over 1 year out. The red line (typical platform) grows steadily as more dividends fall within the option's life. The green line (OptionSpace) stays flat near zero.

Call/Put IV gap across term structure
The red line should be at zero. Every point above zero represents model error — error that contaminates the vol surface, the greeks, and every price derived from them. At 500 DTE, the naive model produces over 5 vol points of ATM call/put divergence.

Your Greeks Are Wrong Too

Wrong vol curve means wrong greeks. Delta, gamma, and vega are all derived from the fitted surface — if the surface is contaminated by a bad forward, every greek inherits the error.

These tables compare greeks at key strikes (25-delta put through 25-delta call). The "Diff %" column shows how far the naive platform's greeks are from ours.

Greek errors at 1 DTE
1 DTE: Even at 1 day to expiry, delta errors of 1–2% and gamma errors of 2–3% add up when you're trading hundreds of contracts. For 0DTE traders making multiple round trips per day, this compounds.
Greek errors at 39 DTE
39 DTE (dividend expiry): Vega errors of 20–40% mean your vol exposure estimate is fundamentally wrong. A 22% delta error on the 25Δ call means you're over-hedging by 22 shares per 100 contracts. These aren't rounding errors — they're systematic biases from the wrong forward.
Greek errors at 102 DTE
102 DTE: The errors persist and in some cases grow. A 32% vega error means if you think you have $1,000 of vega exposure, you actually have $1,320. That's the difference between a hedged book and an unhedged one.

How OptionSpace Gets It Right

Implied Forward

We imply the forward price directly from put-call parity at each expiry — no assumptions about dividends or rates needed. The market tells us the forward.

Implied Rates

Instead of using a flat SOFR rate, we imply a full rate term structure from SPX put-call parity. The rate at 30 days can differ from the rate at 180 days by 40+ basis points.

Discrete Dividends

We model each dividend as a discrete cash payment at its ex-date, not a continuous yield. This matters for short-dated options near a dividend — exactly where the naive approach fails worst.

American Exercise

SPY, AAPL, QQQ, and every equity option are American-exercise. We use a proper American pricing model that accounts for the early exercise boundary — not the European Black-Scholes formula.

Stop Trading on Bad Data

Join the waitlist for OptionSpace and get access to institutional-quality vol analytics.

Get Early Access

Free tier available. No credit card required.