When you evaluate a trade, let’s say you are thinking about buying NVDA stock, you have to consider two different concepts at the same time without actively thinking about them. The first is abstract – Nvidia the company and what it represents. This is what you think about when you think of the trade. You think in ‘meaning space’. The second is concrete – the instrument itself, the ticker NVDA, that you will use to execute your trade.
For NVDA, and for stocks in general, the meaning of NVDA today (Nvidia, the company as it exists now) and the instrument NVDA (the ticker, which has traded for decades) stay in sync for a long time. They don’t change much over seconds, hours, days, weeks or even months. This is what makes thinking about trading stocks easier for people. The meaning that NVDA represents today is what it has represented for many years. It might not be exactly comparable to what NVDA represented ten years ago, but that change is gradual as the company evolves.
This overlap between meaning and instrument space breaks down for derivatives like options. Let’s take an example to dig in: the meaning of the NVDA $220 strike call option expiring on 21 September 2026 is continuously changing. You can’t compare today’s price of that option with its price a day ago, or a month ago, let alone longer, because it meant different things each time. This is what makes it so hard to think about trading options.
We think in meaning space. But if the meaning of an instrument is constantly changing, how do we evaluate whether the trade makes sense?
The solution is to normalize the two spaces. You think in meaning space and the normalization can help you map that meaning to an instrument. That’s a bit heavy to grasp, but take your time to let that sink in.
What kind of normalization, you might ask? In our example, instead of thinking about the NVDA $220 strike call expiring on 21 September, think about what it means right now: given the current stock price, volatility, and time to expiration, one normalized meaning might be NVDA 20-delta call expiring in a week (a 20-delta call has roughly a one-in-five chance of finishing in the money). Now, this meaning can be mapped to an instrument at any time in the past or future, provided you have high-quality data and the tools to do it. That’s what OptionSpace was built for.
For starters, one of the first questions anyone asks of a stock: how does its price today compare with its own history?
A worked example: the NVDA 20-delta call, one week out
Take the instrument from the paragraph above. At 15:30 ET on 14 September 2026, with NVDA at $212.15, the $220 strike call expiring 21 September was a 0.21-delta call with seven days to expiry, quoted $1.03 to $1.08. By the close, with NVDA at $210.70, its delta was 0.18. Here is what each coordinate space shows about it.
Instrument space
Let’s look at the exact contract in instrument space. The contract has existed for five trading sessions. Every fit of it, from the first print on the morning it was listed to the close on 14 September:
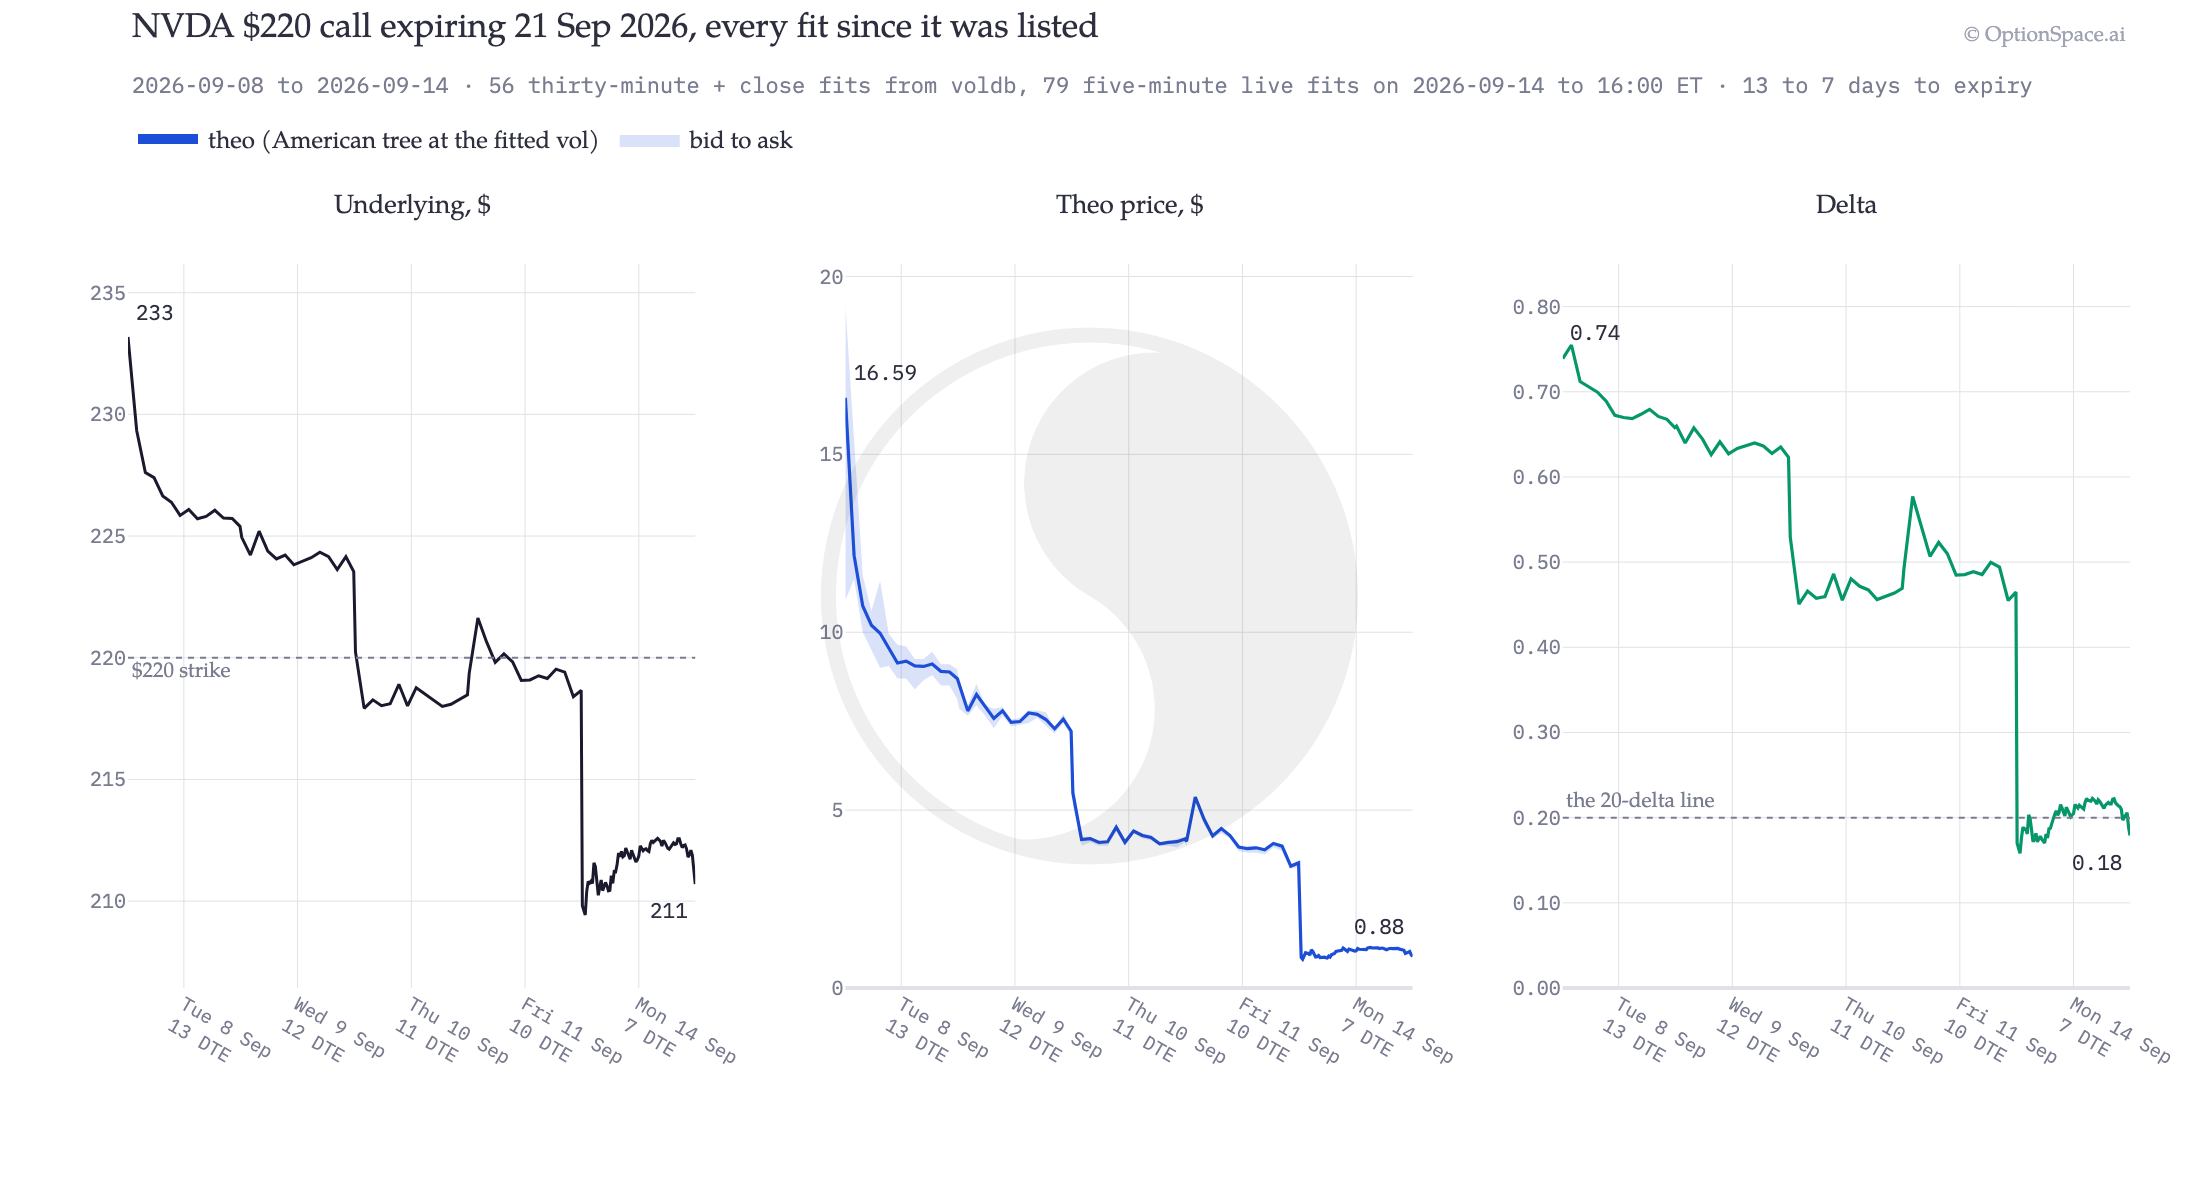
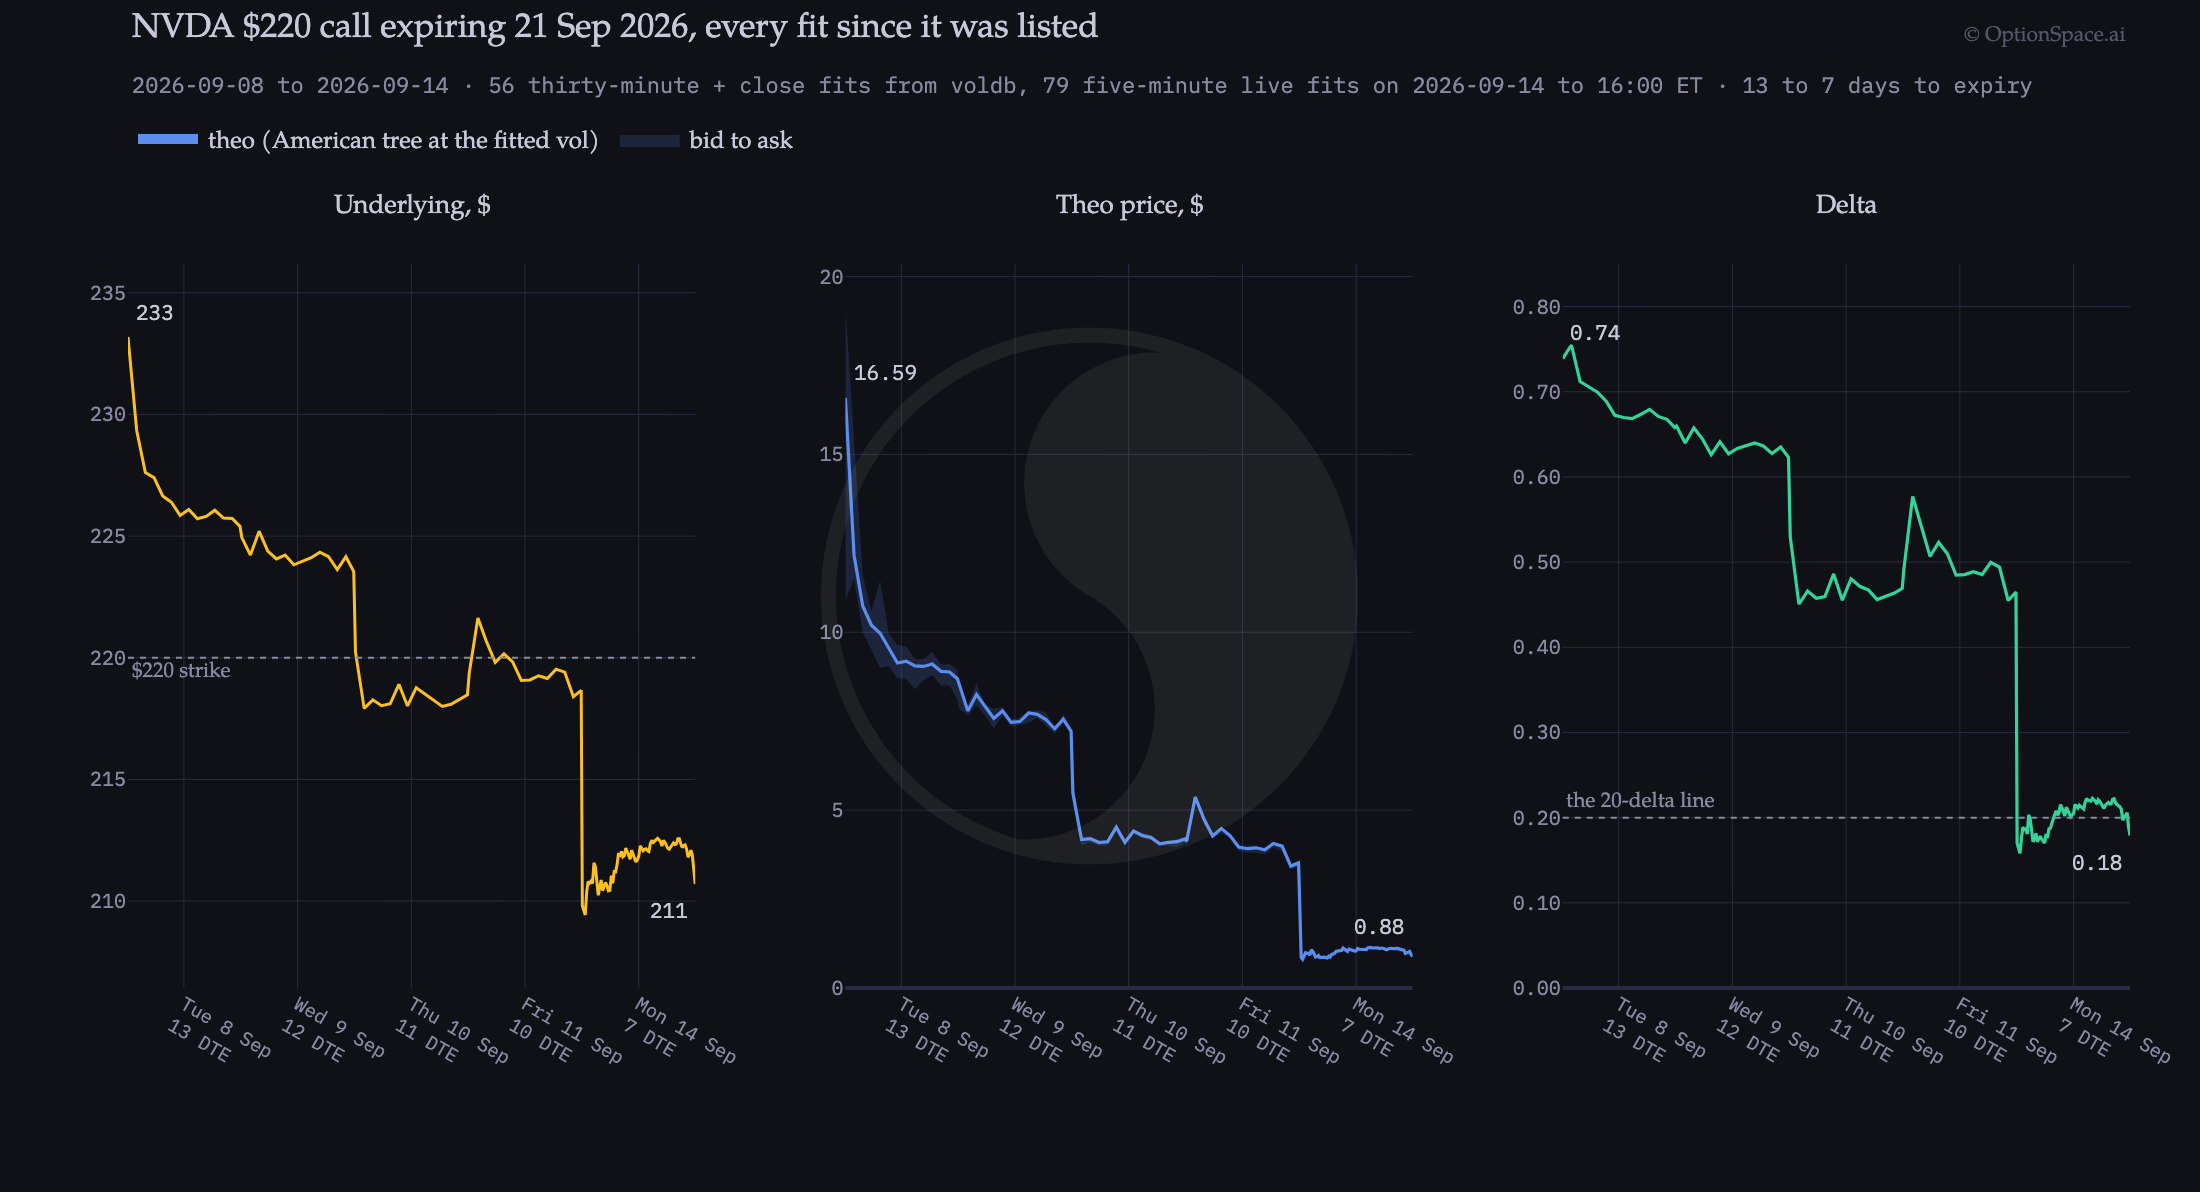
Same ticker, different thing. The contract was listed on the morning of 8 September with NVDA at $233. The $220 strike call was $13 in the money, a 74-delta option, and its theo was $16.59. Five sessions later NVDA closed at $210.70 and the same contract was an 18-delta option worth $0.88. Its price fell 95 percent over this period. The option simply stopped meaning what it meant. Comparing its price on 8 September to its price today tells you nothing about whether NVDA options got cheaper, or more expensive.
Meaning space
Now fix the meaning instead of the ticker: NVDA 0.18 to 0.22 delta call, six to eight days to expiration. At each fit the fitted surface tells you which listed instrument that is, if any, and what the market charges for it in implied vol. It is possible that there are no instruments matching that definition on many dates. We have compressed the time axis for those dates.
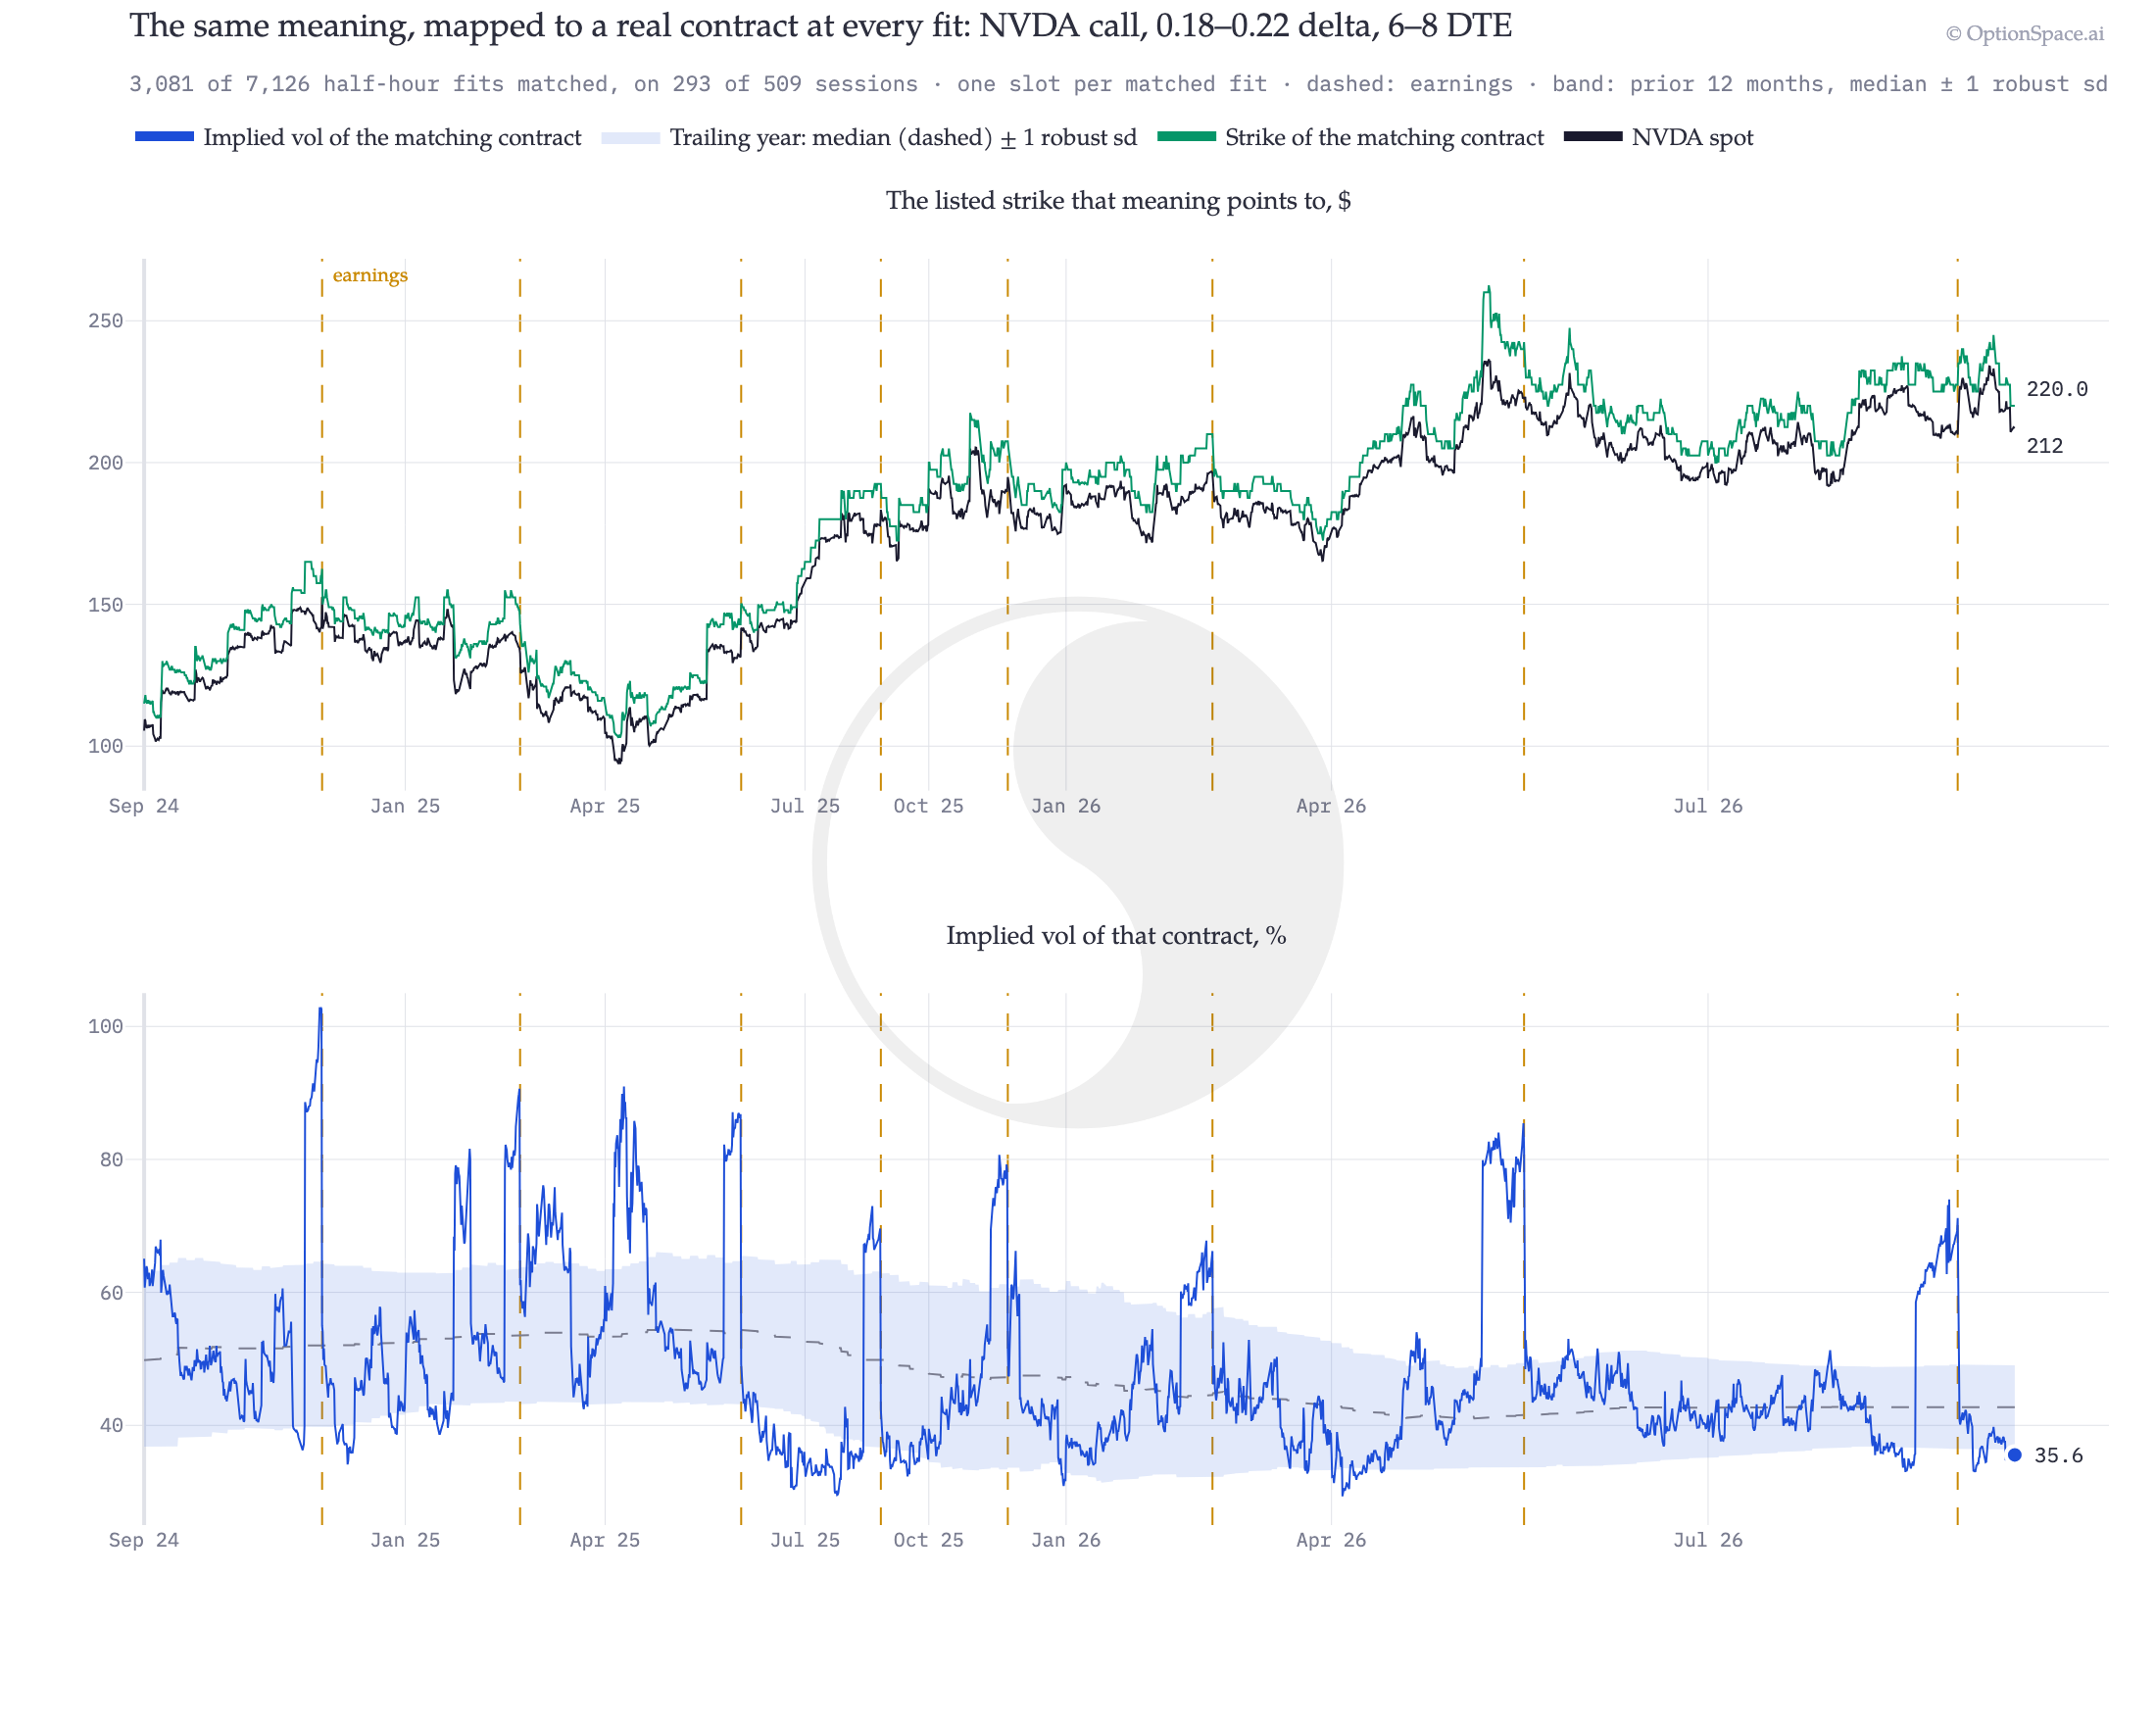
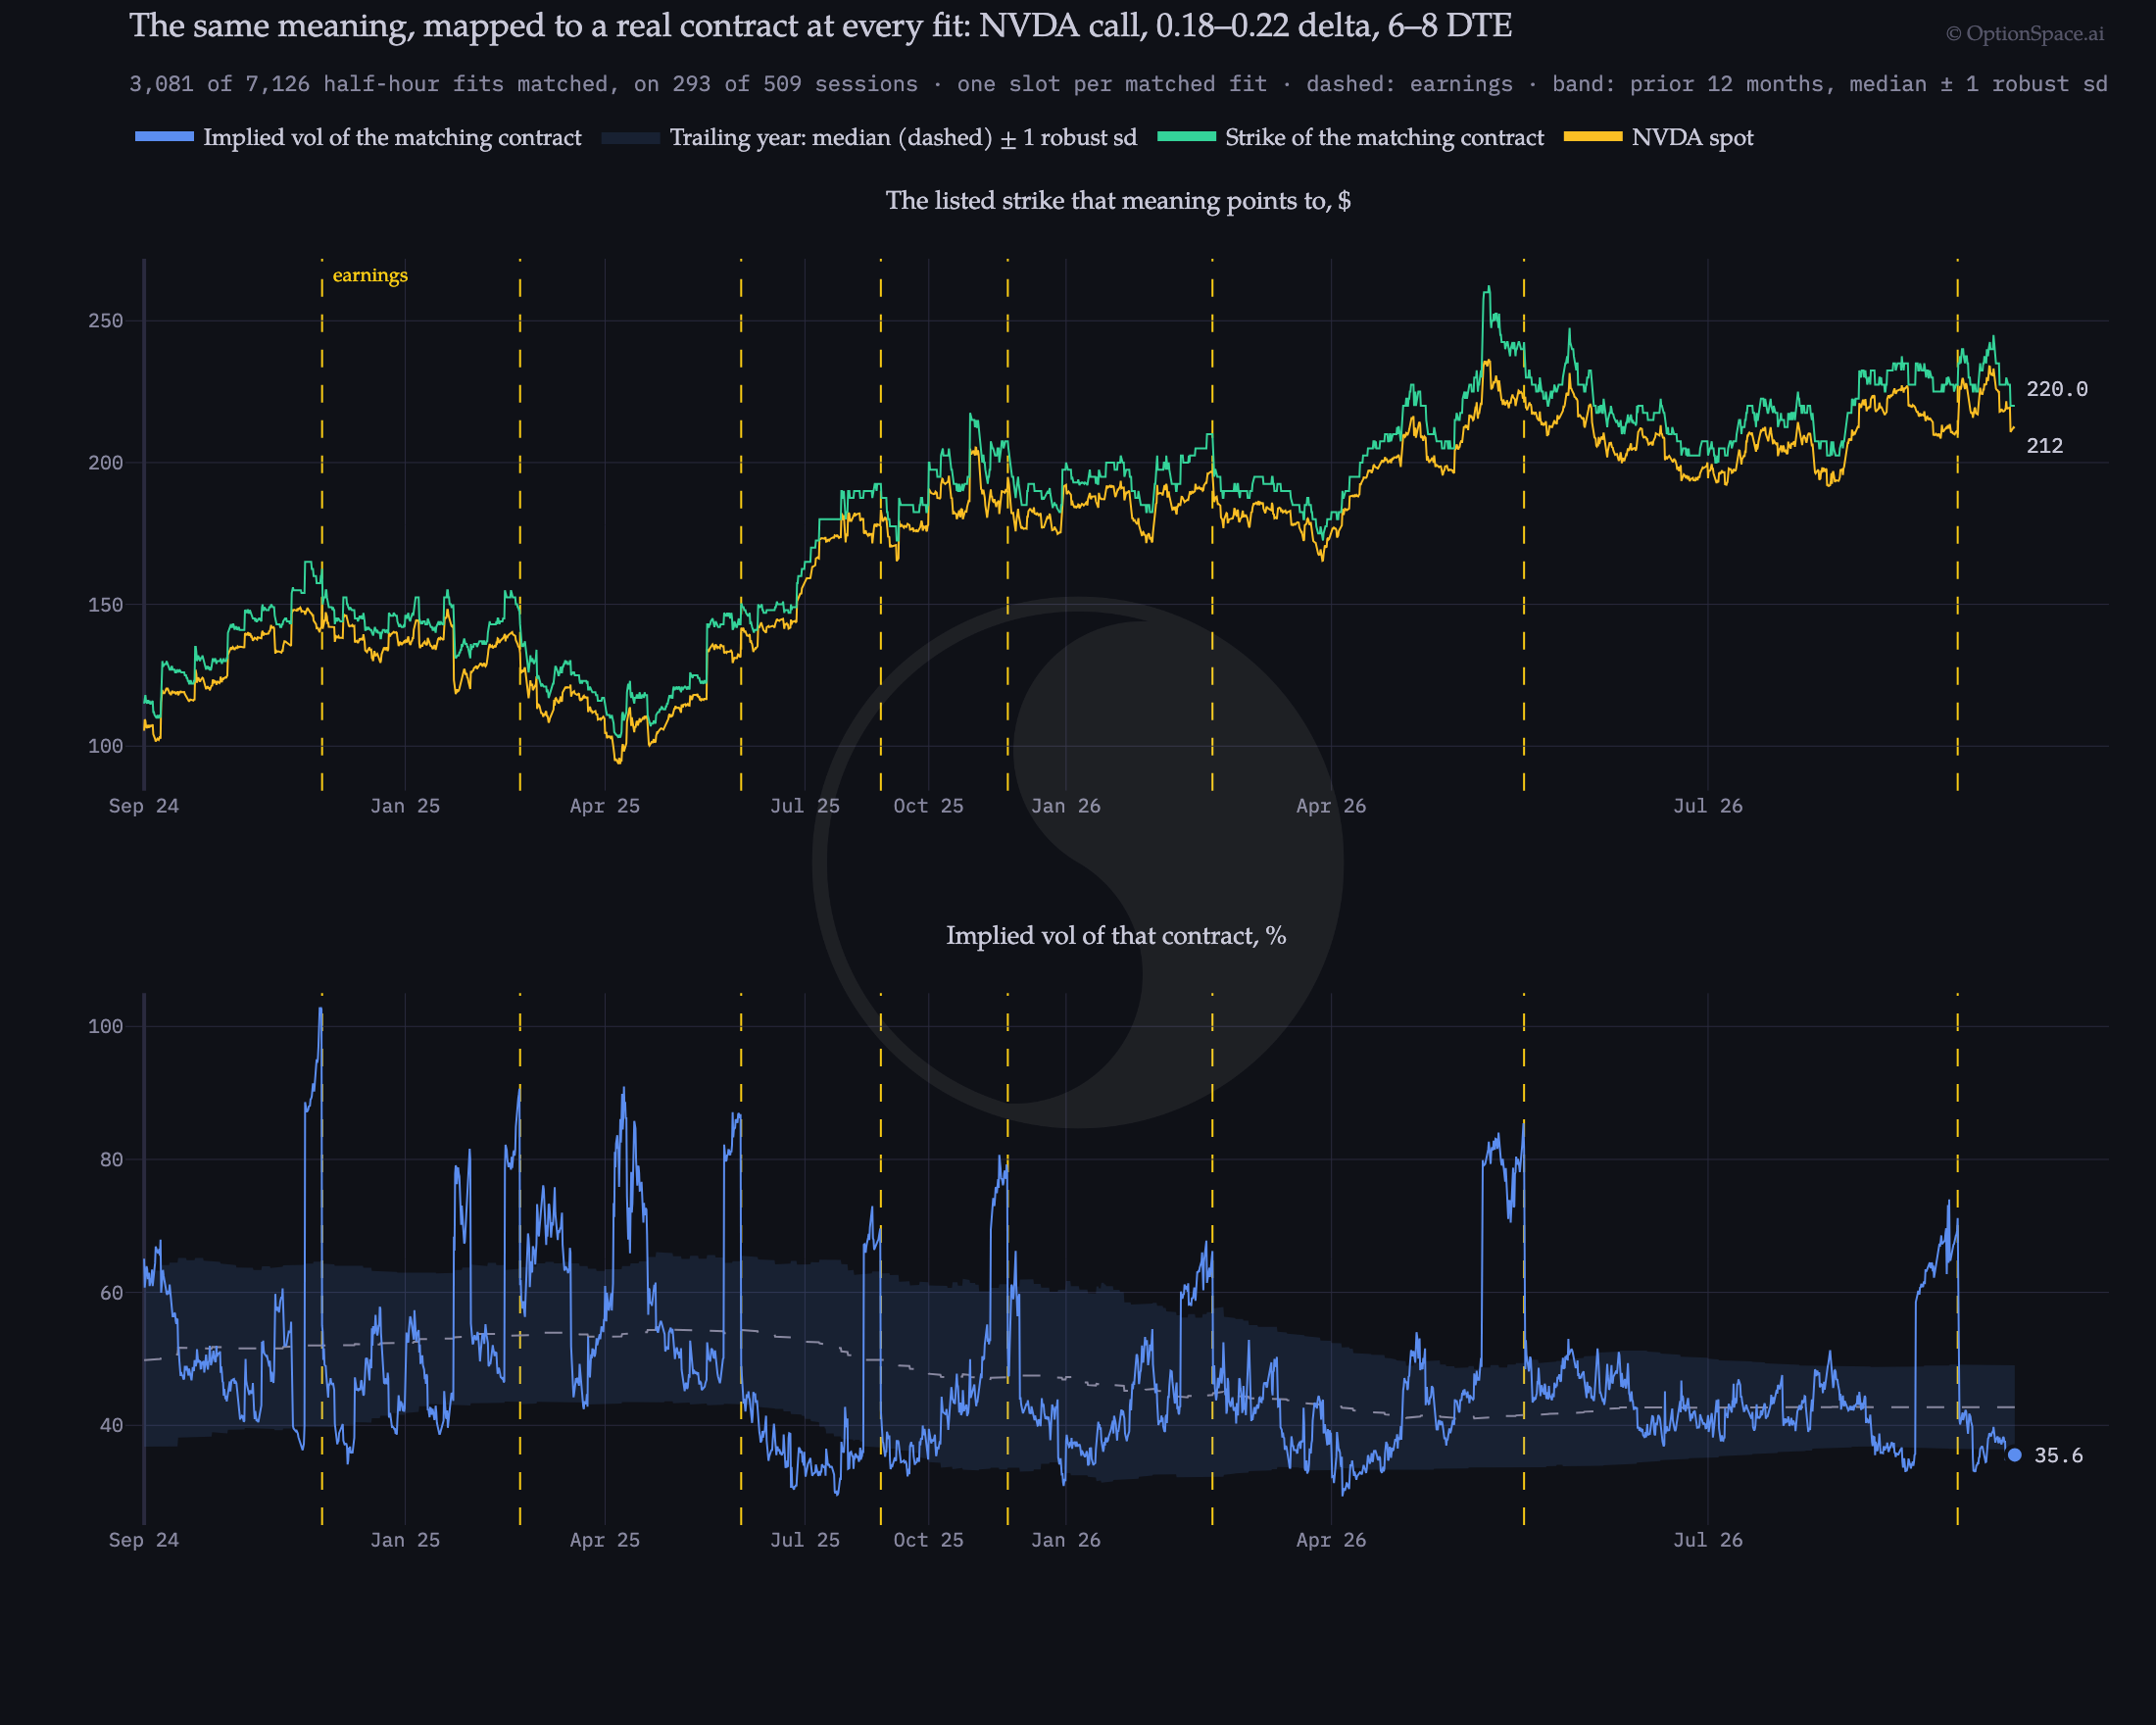
A comparable series, at every fit where it can exist. On 5 September 2024 the meaning mapped to the $115 strike call expiring 13 September, at 63 percent vol; at 15:30 on 14 September 2026 it was the $220 call expiring 21 September, at 36 percent. In between it existed at 3,081 of the 7,126 half-hour fits. The rest are not missing data. Until June 2026 NVDA listed one expiry a week, on Fridays, so six to eight days out only exists on a Thursday or a Friday, and the strike grid has to put a contract inside a four-point delta band on top of that: 33 of 84 sessions in late 2024, 100 of 250 in 2025. Since Monday, Wednesday and Friday expiries arrived in June 2026 the meaning has had a contract on 57 of 59 sessions, at 584 of 826 fits. Even so, by the 14 September close the $220 strike call had drifted to 0.179 delta, a hair under the band, and the meaning mapped to nothing.
| Fit | NVDA | Matching contract | Delta | Theo | Theo, % of spot | Implied vol |
|---|---|---|---|---|---|---|
| 5 Sep 2024, close | 106.92 | $115 call · 13 Sep 2024 · 8 DTE | 0.21 | $0.99 | 0.92% | 63.4% |
| 6 Mar 2025, close | 110.86 | $121 call · 14 Mar 2025 · 8 DTE | 0.20 | $1.17 | 1.05% | 74.8% |
| 11 Sep 2025, close | 177.30 | $185 call · 19 Sep 2025 · 8 DTE | 0.18 | $0.77 | 0.44% | 34.2% |
| 3 Mar 2026, close | 180.06 | $190 call · 11 Mar 2026 · 8 DTE | 0.19 | $1.04 | 0.57% | 44.2% |
| 14 Sep 2026, 15:30 | 212.15 | $220 call · 21 Sep 2026 · 7 DTE | 0.21 | $1.06 | 0.50% | 35.6% |
| 14 Sep 2026, close | 210.70 | none in the band ($220 call · 21 Sep · 7 DTE is 0.179 delta) | N/A | N/A | N/A | N/A |
Five different options instruments on different dates, with the same meaning. The last two columns are comparable to each other.
How strict is a meaningThe narrower the definition, the fewer the fits
The band is a choice. Narrow it to 0.19 to 0.21 delta, exactly seven days to expiry and the same two years look like this:
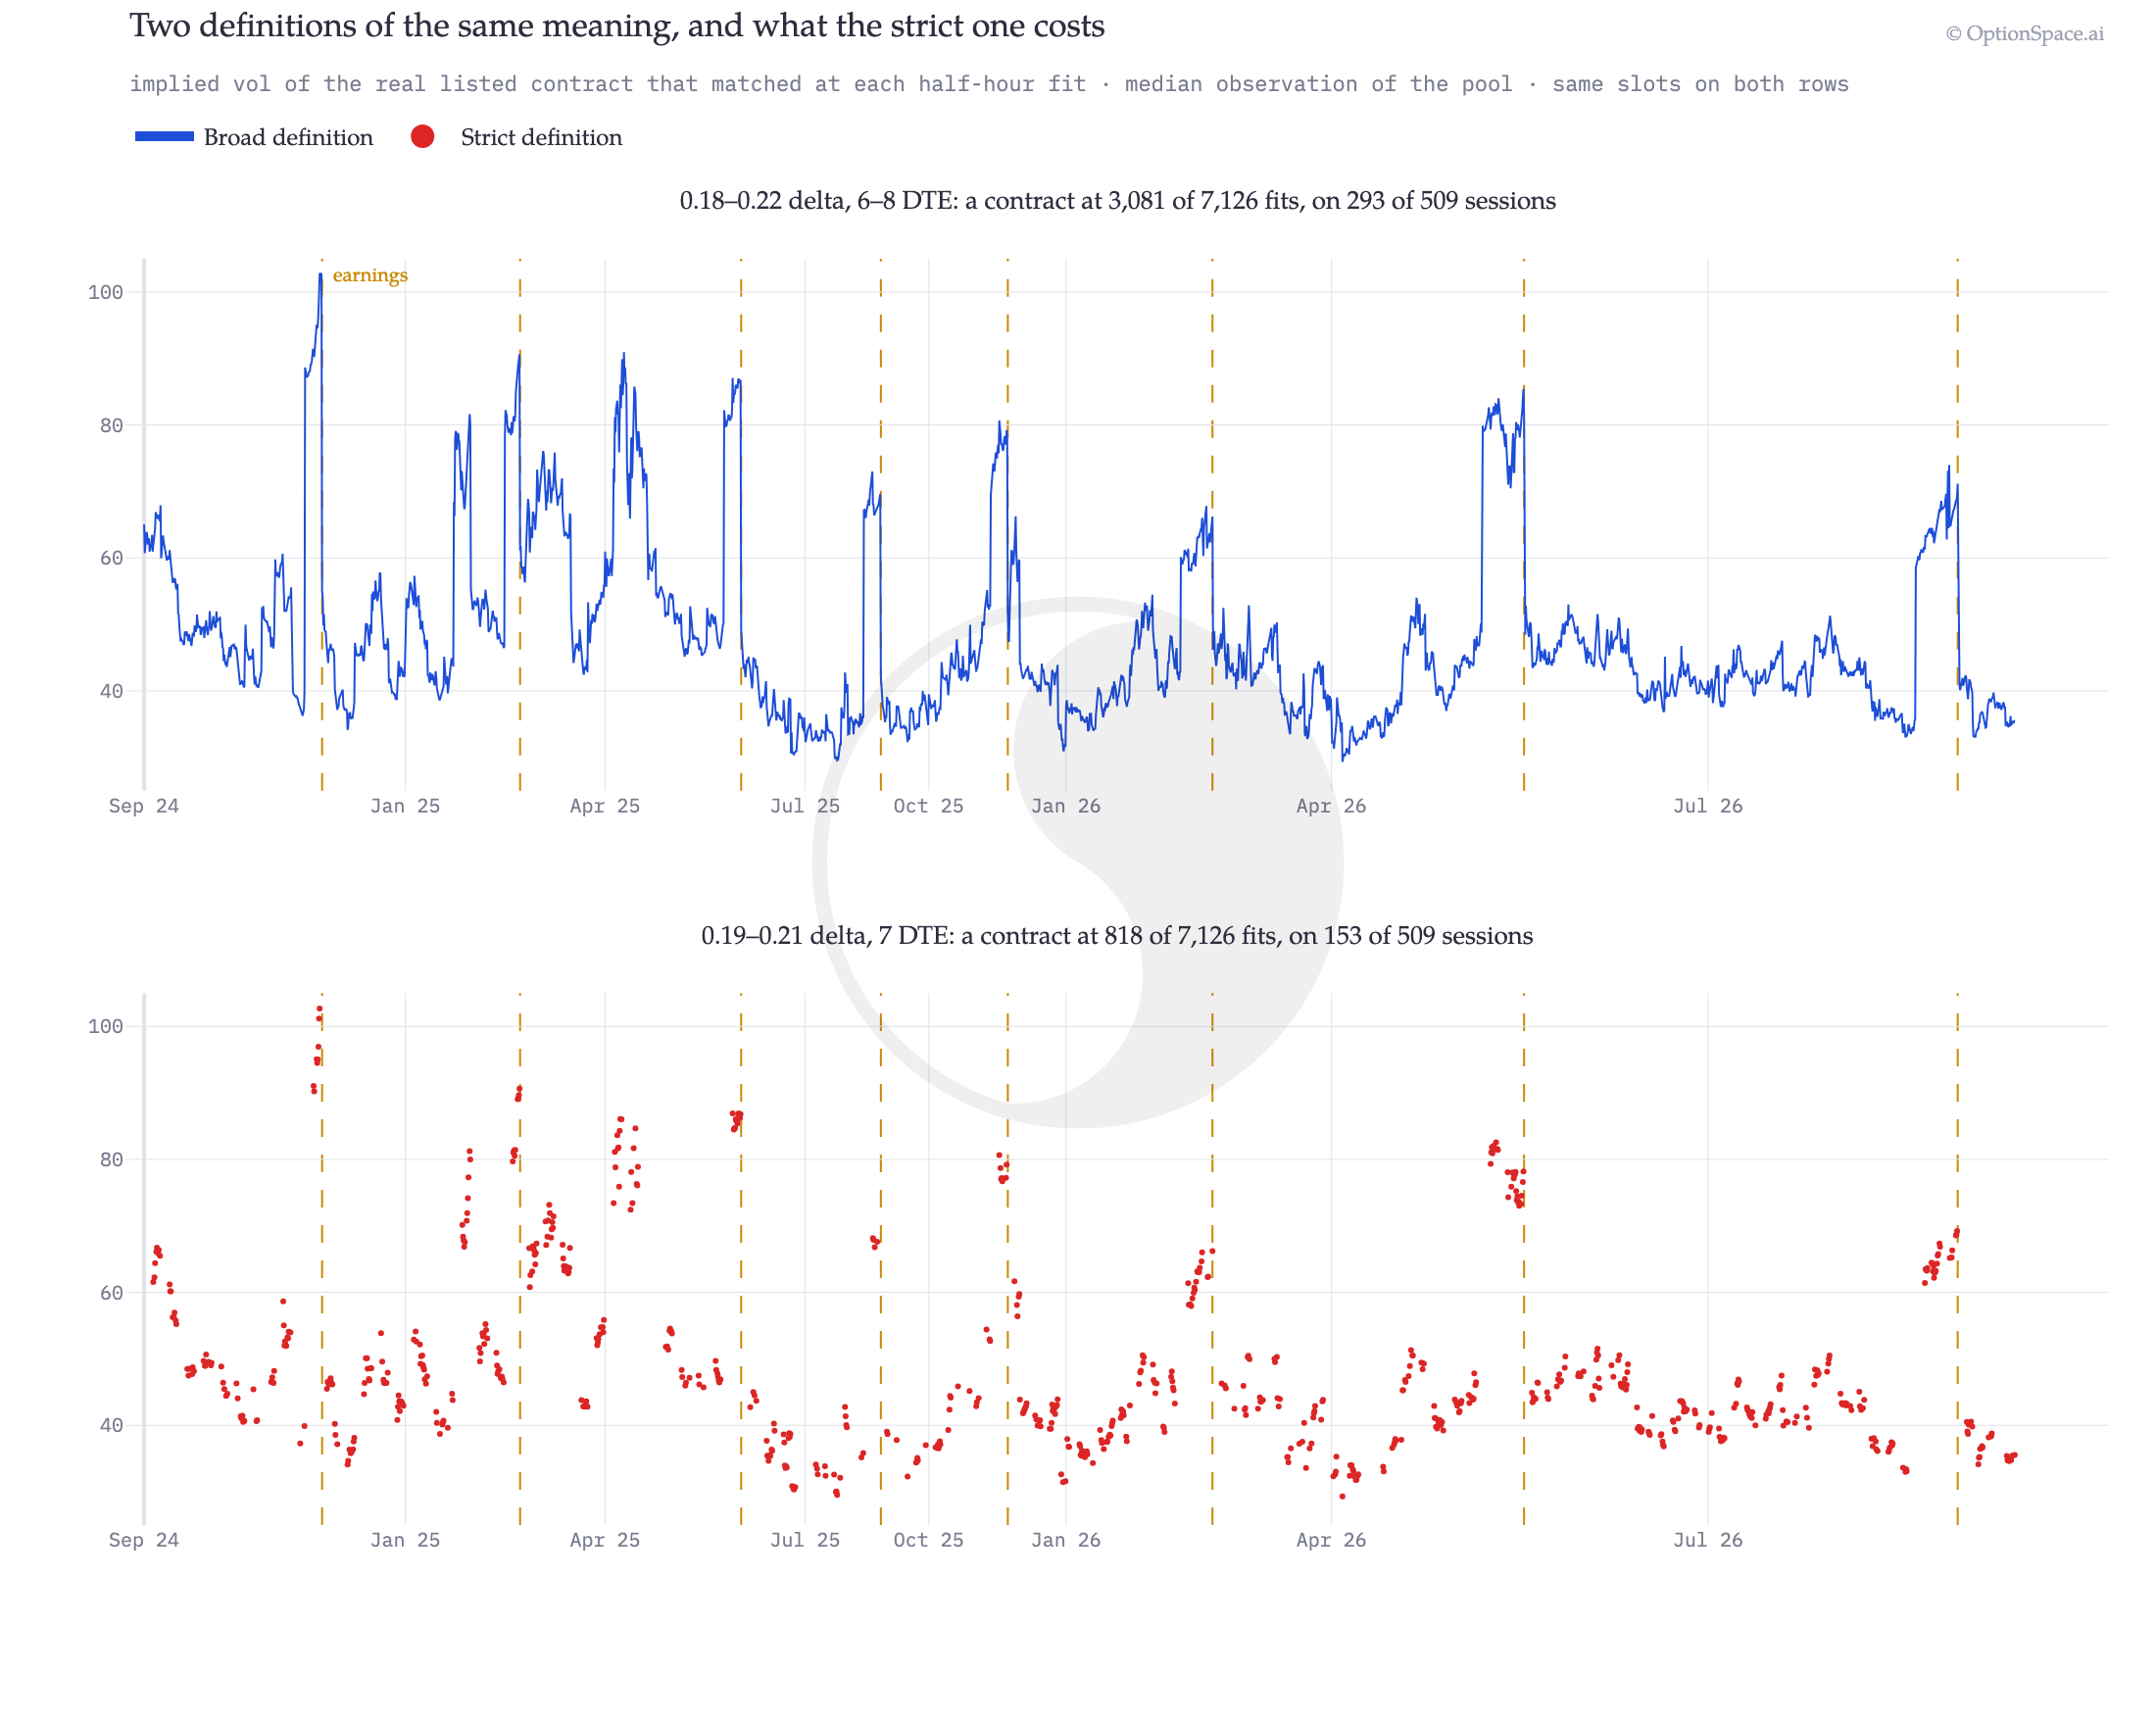
A quarter of the evidence. Exactly seven days out is a Friday-only affair on a Friday-only calendar, and adjacent $2.50 strikes are roughly eight delta points apart at this tenor, so a two-point band catches a contract about one time in four even on the right day. Every question below is asked of the broad series; the strict one would answer it with 818 fits instead of 3,081.
Cheap or rich
Once the price of the meaning is a series, “is this expensive?” becomes a question we can ask. There are many factors to consider here, and this is NOT INVESTMENT ADVICE. We are exploring how to think systematically about a complex problem by asking questions in the correct coordinate space. Let’s ask a few more questions and make the picture more coherent. Take every matched fit of the prior twelve months and ask where the latest one sits:
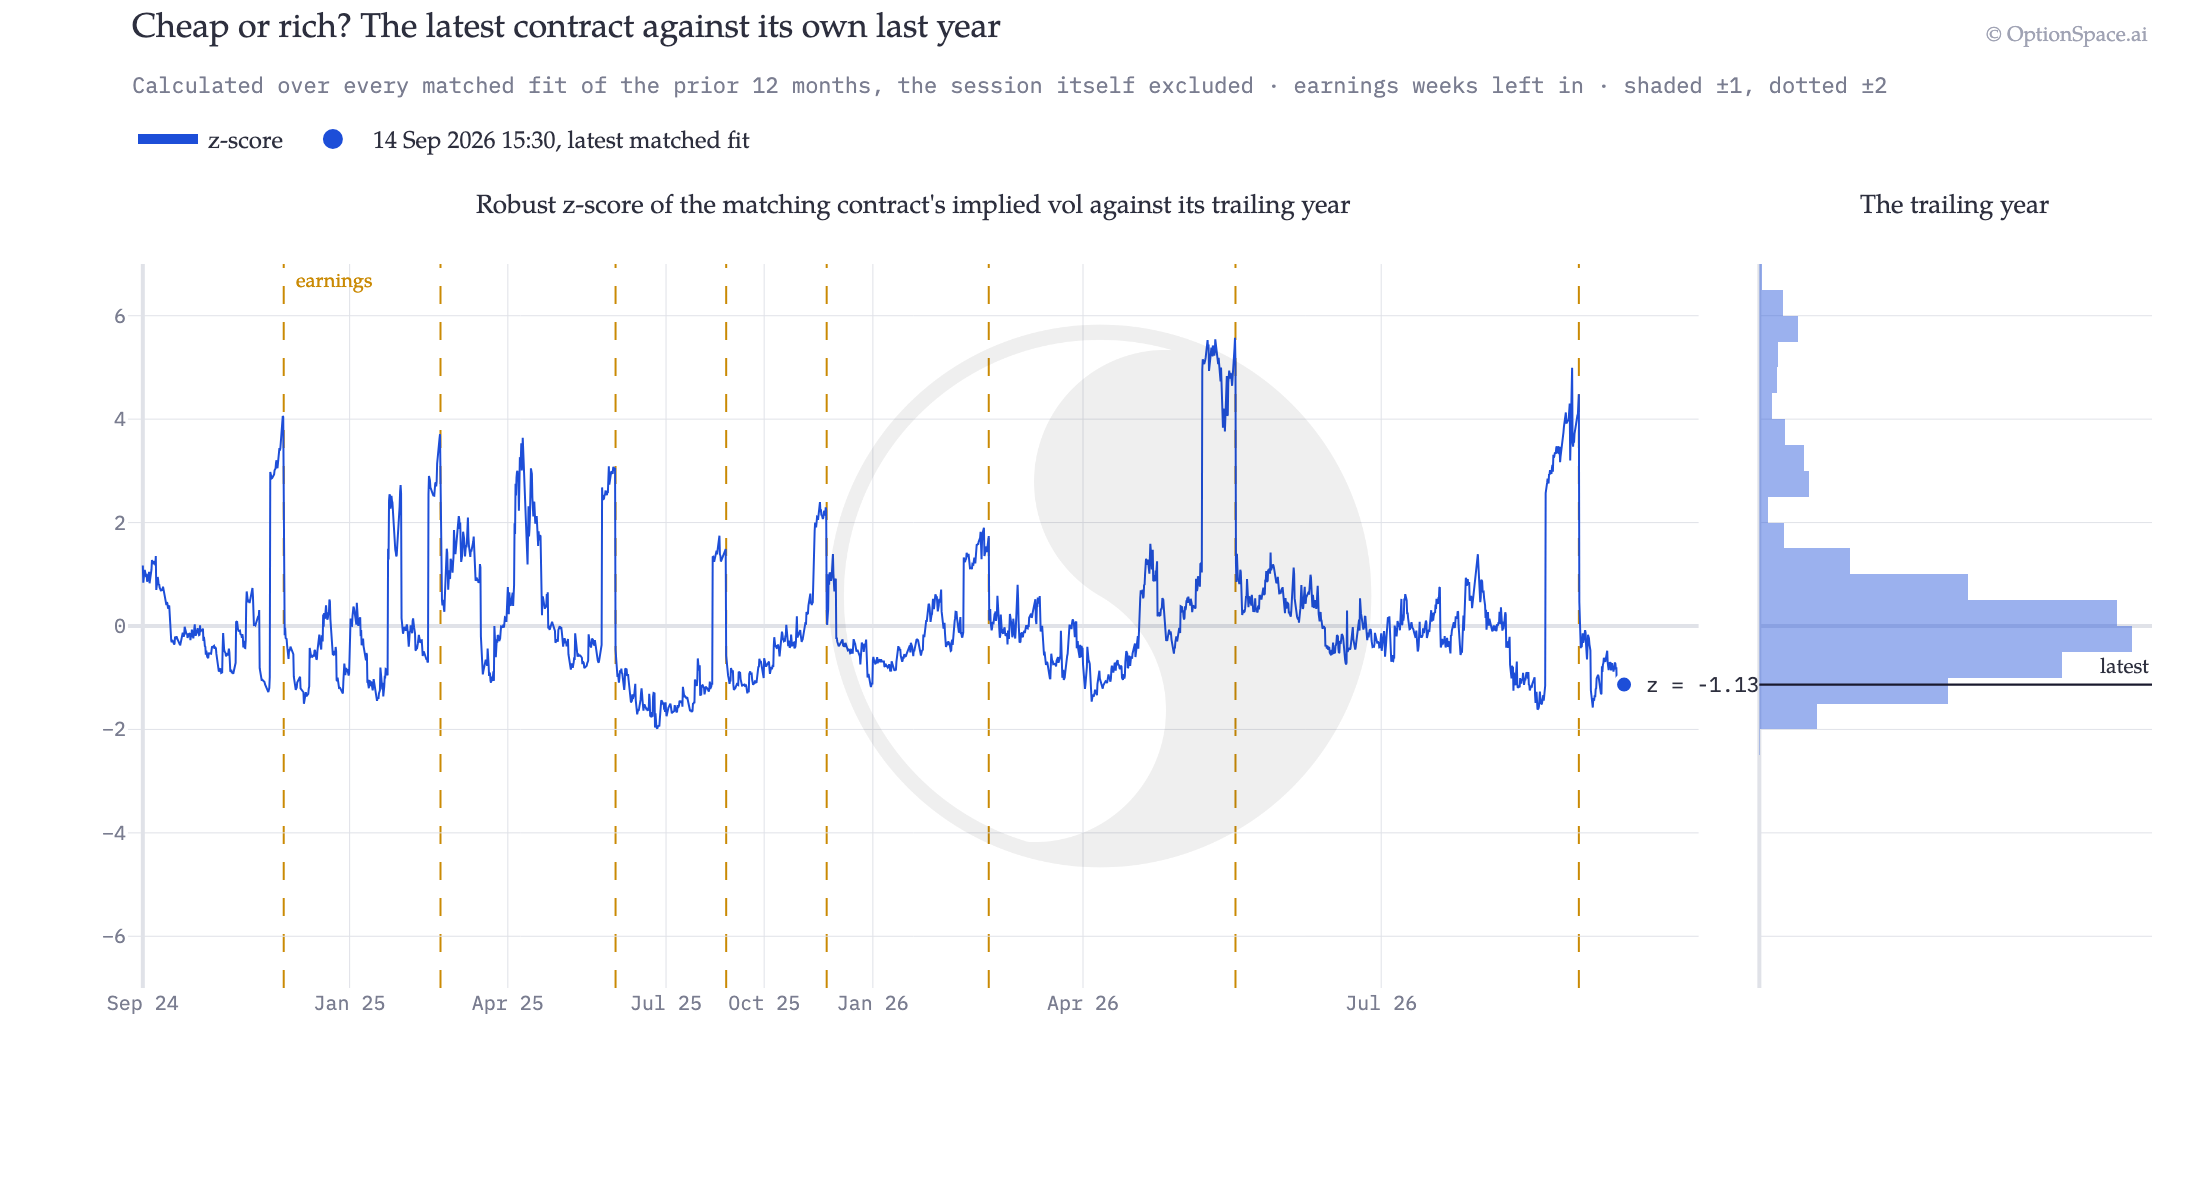
Against its own last year, the weekly 20-delta call is cheap: 1.1 robust standard deviations below the median and lower than 90 percent of the comparable fits since last September. That sentence is only possible because it is a statement about the price of a meaning. Whether it is cheap for a reason (there is no earnings report inside the week, for one) is the next question.
Earnings outThe same question, with the earnings variance taken out
At 221 of the 1,812 matched fits in the trailing year an earnings report sat inside the contract’s life, and at those fits the meaning includes the print. Since the earnings are a known (estimatable) event that affects options pricing, to correctly compare current prices with historical prices we need to take this known source of noise out. OptionSpace decomposes every term structure into a baseline and a variance per event.
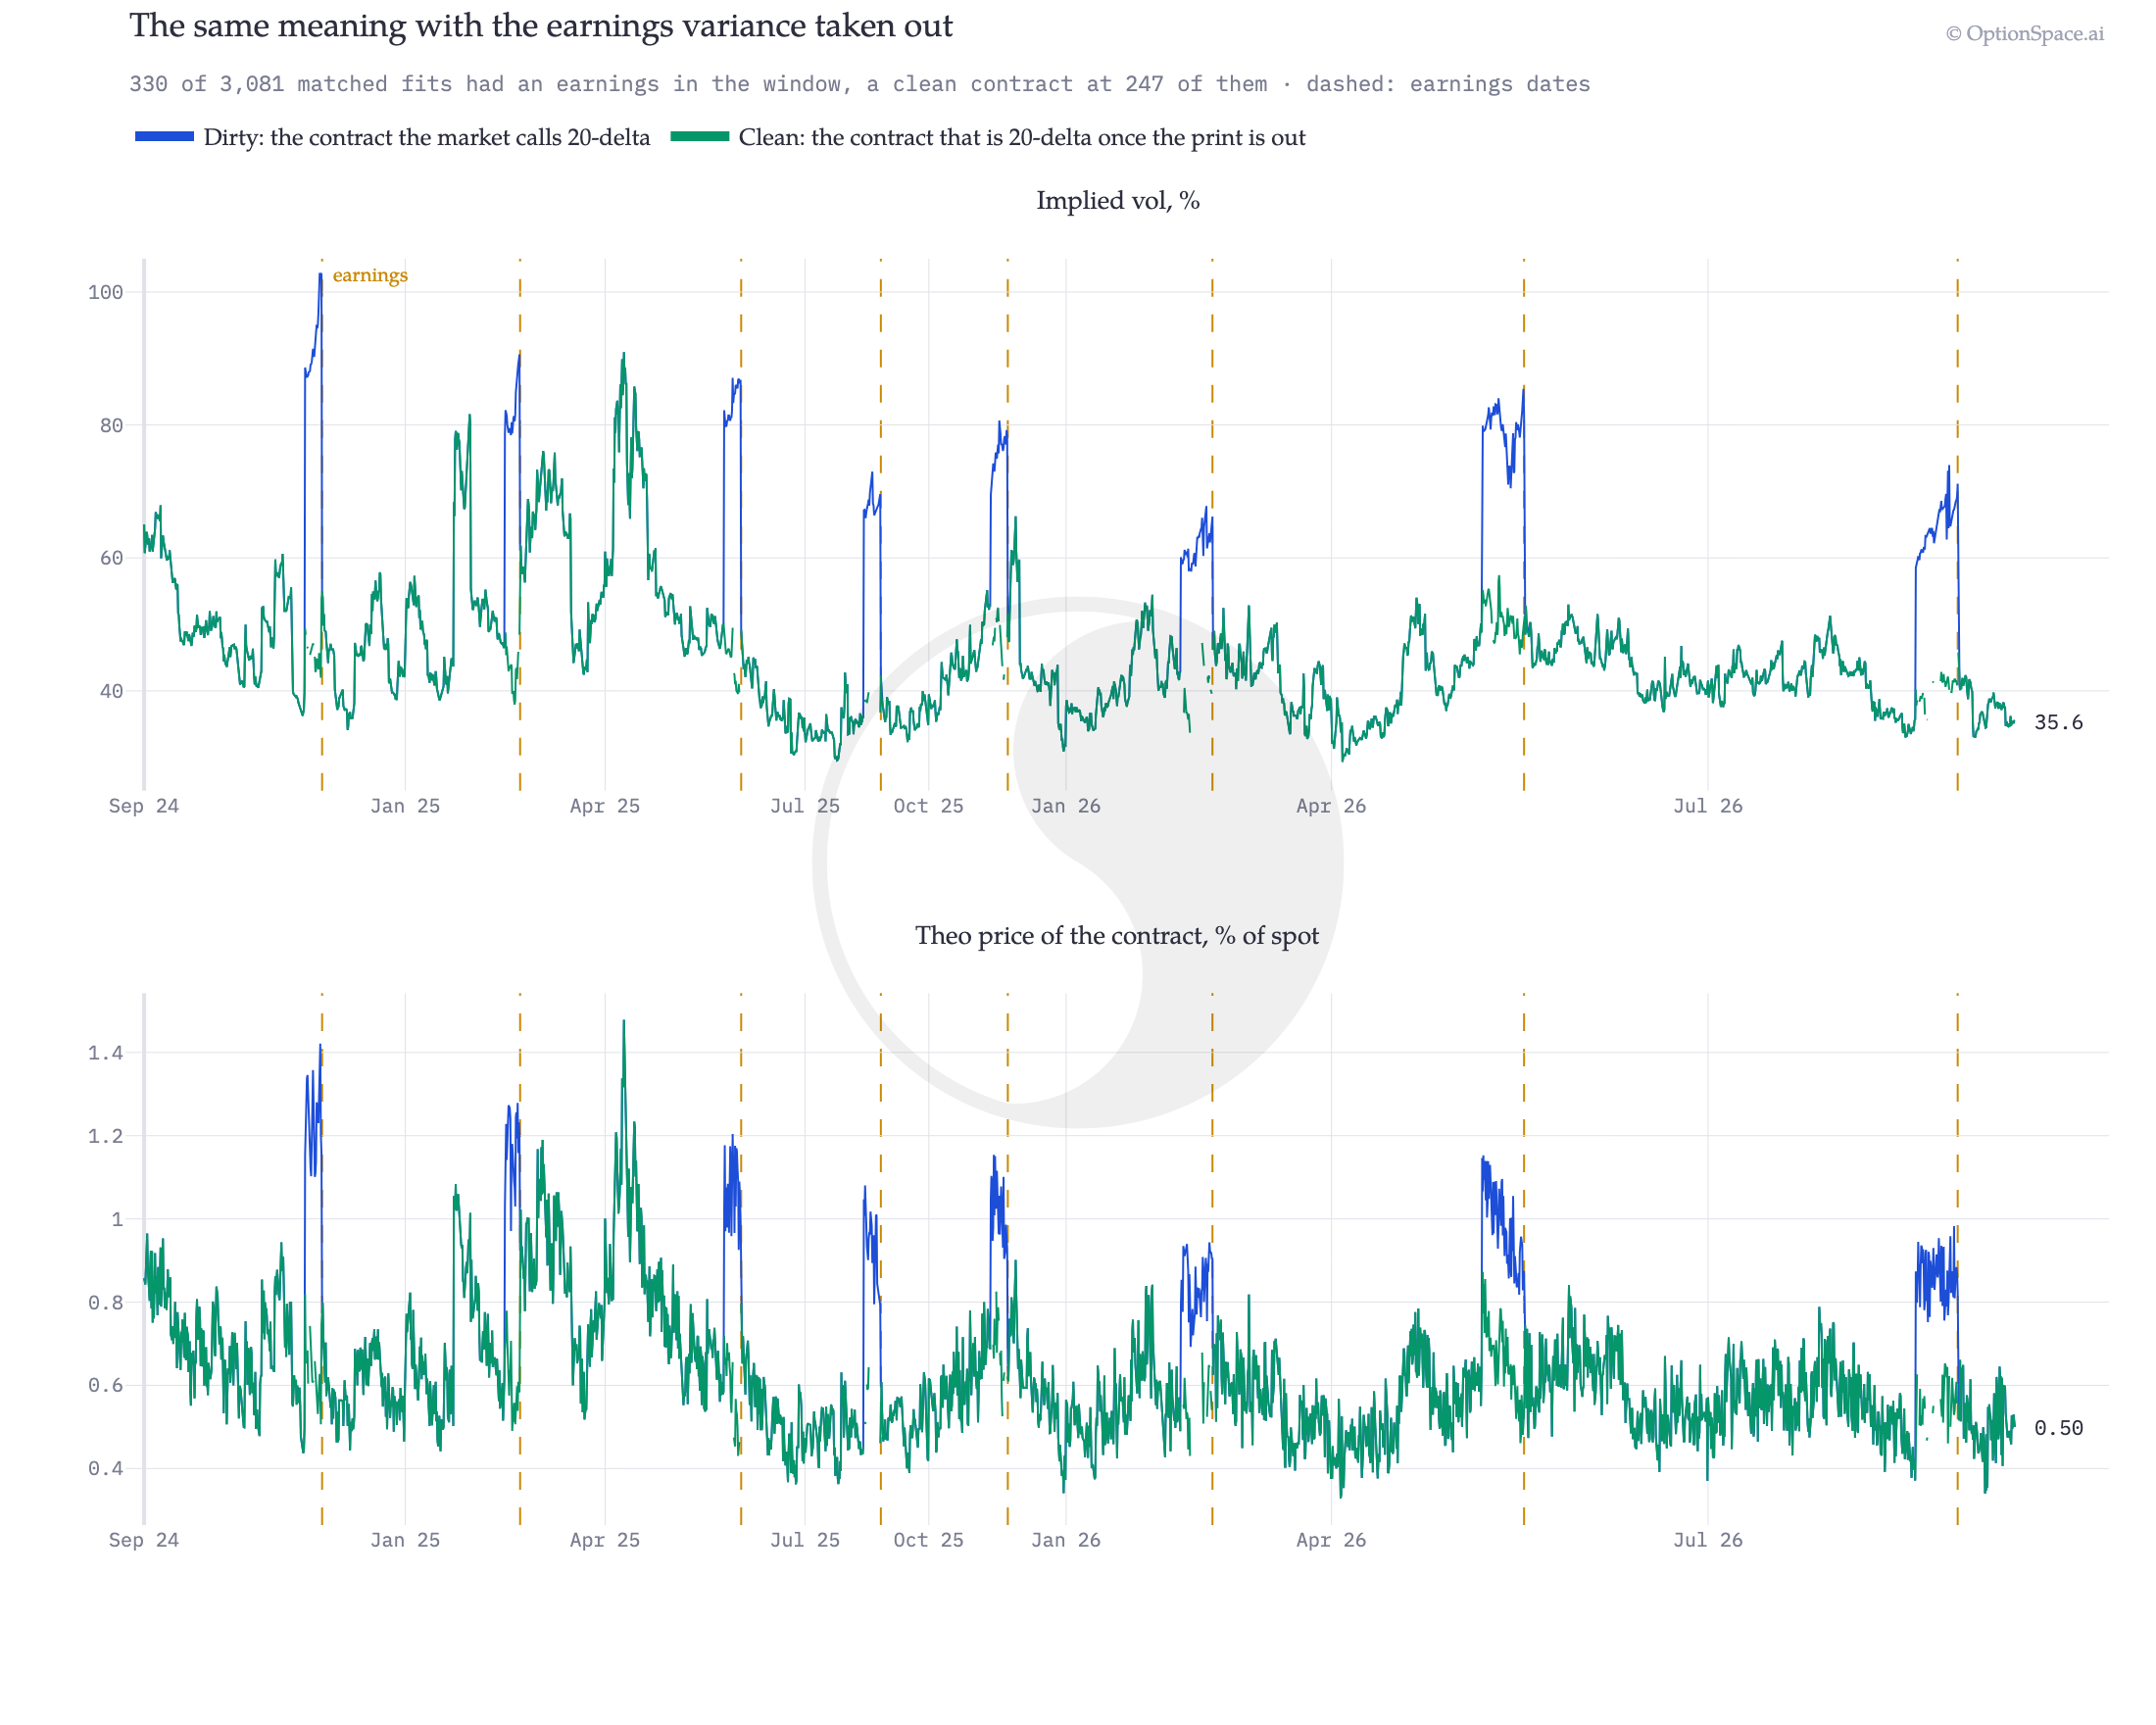
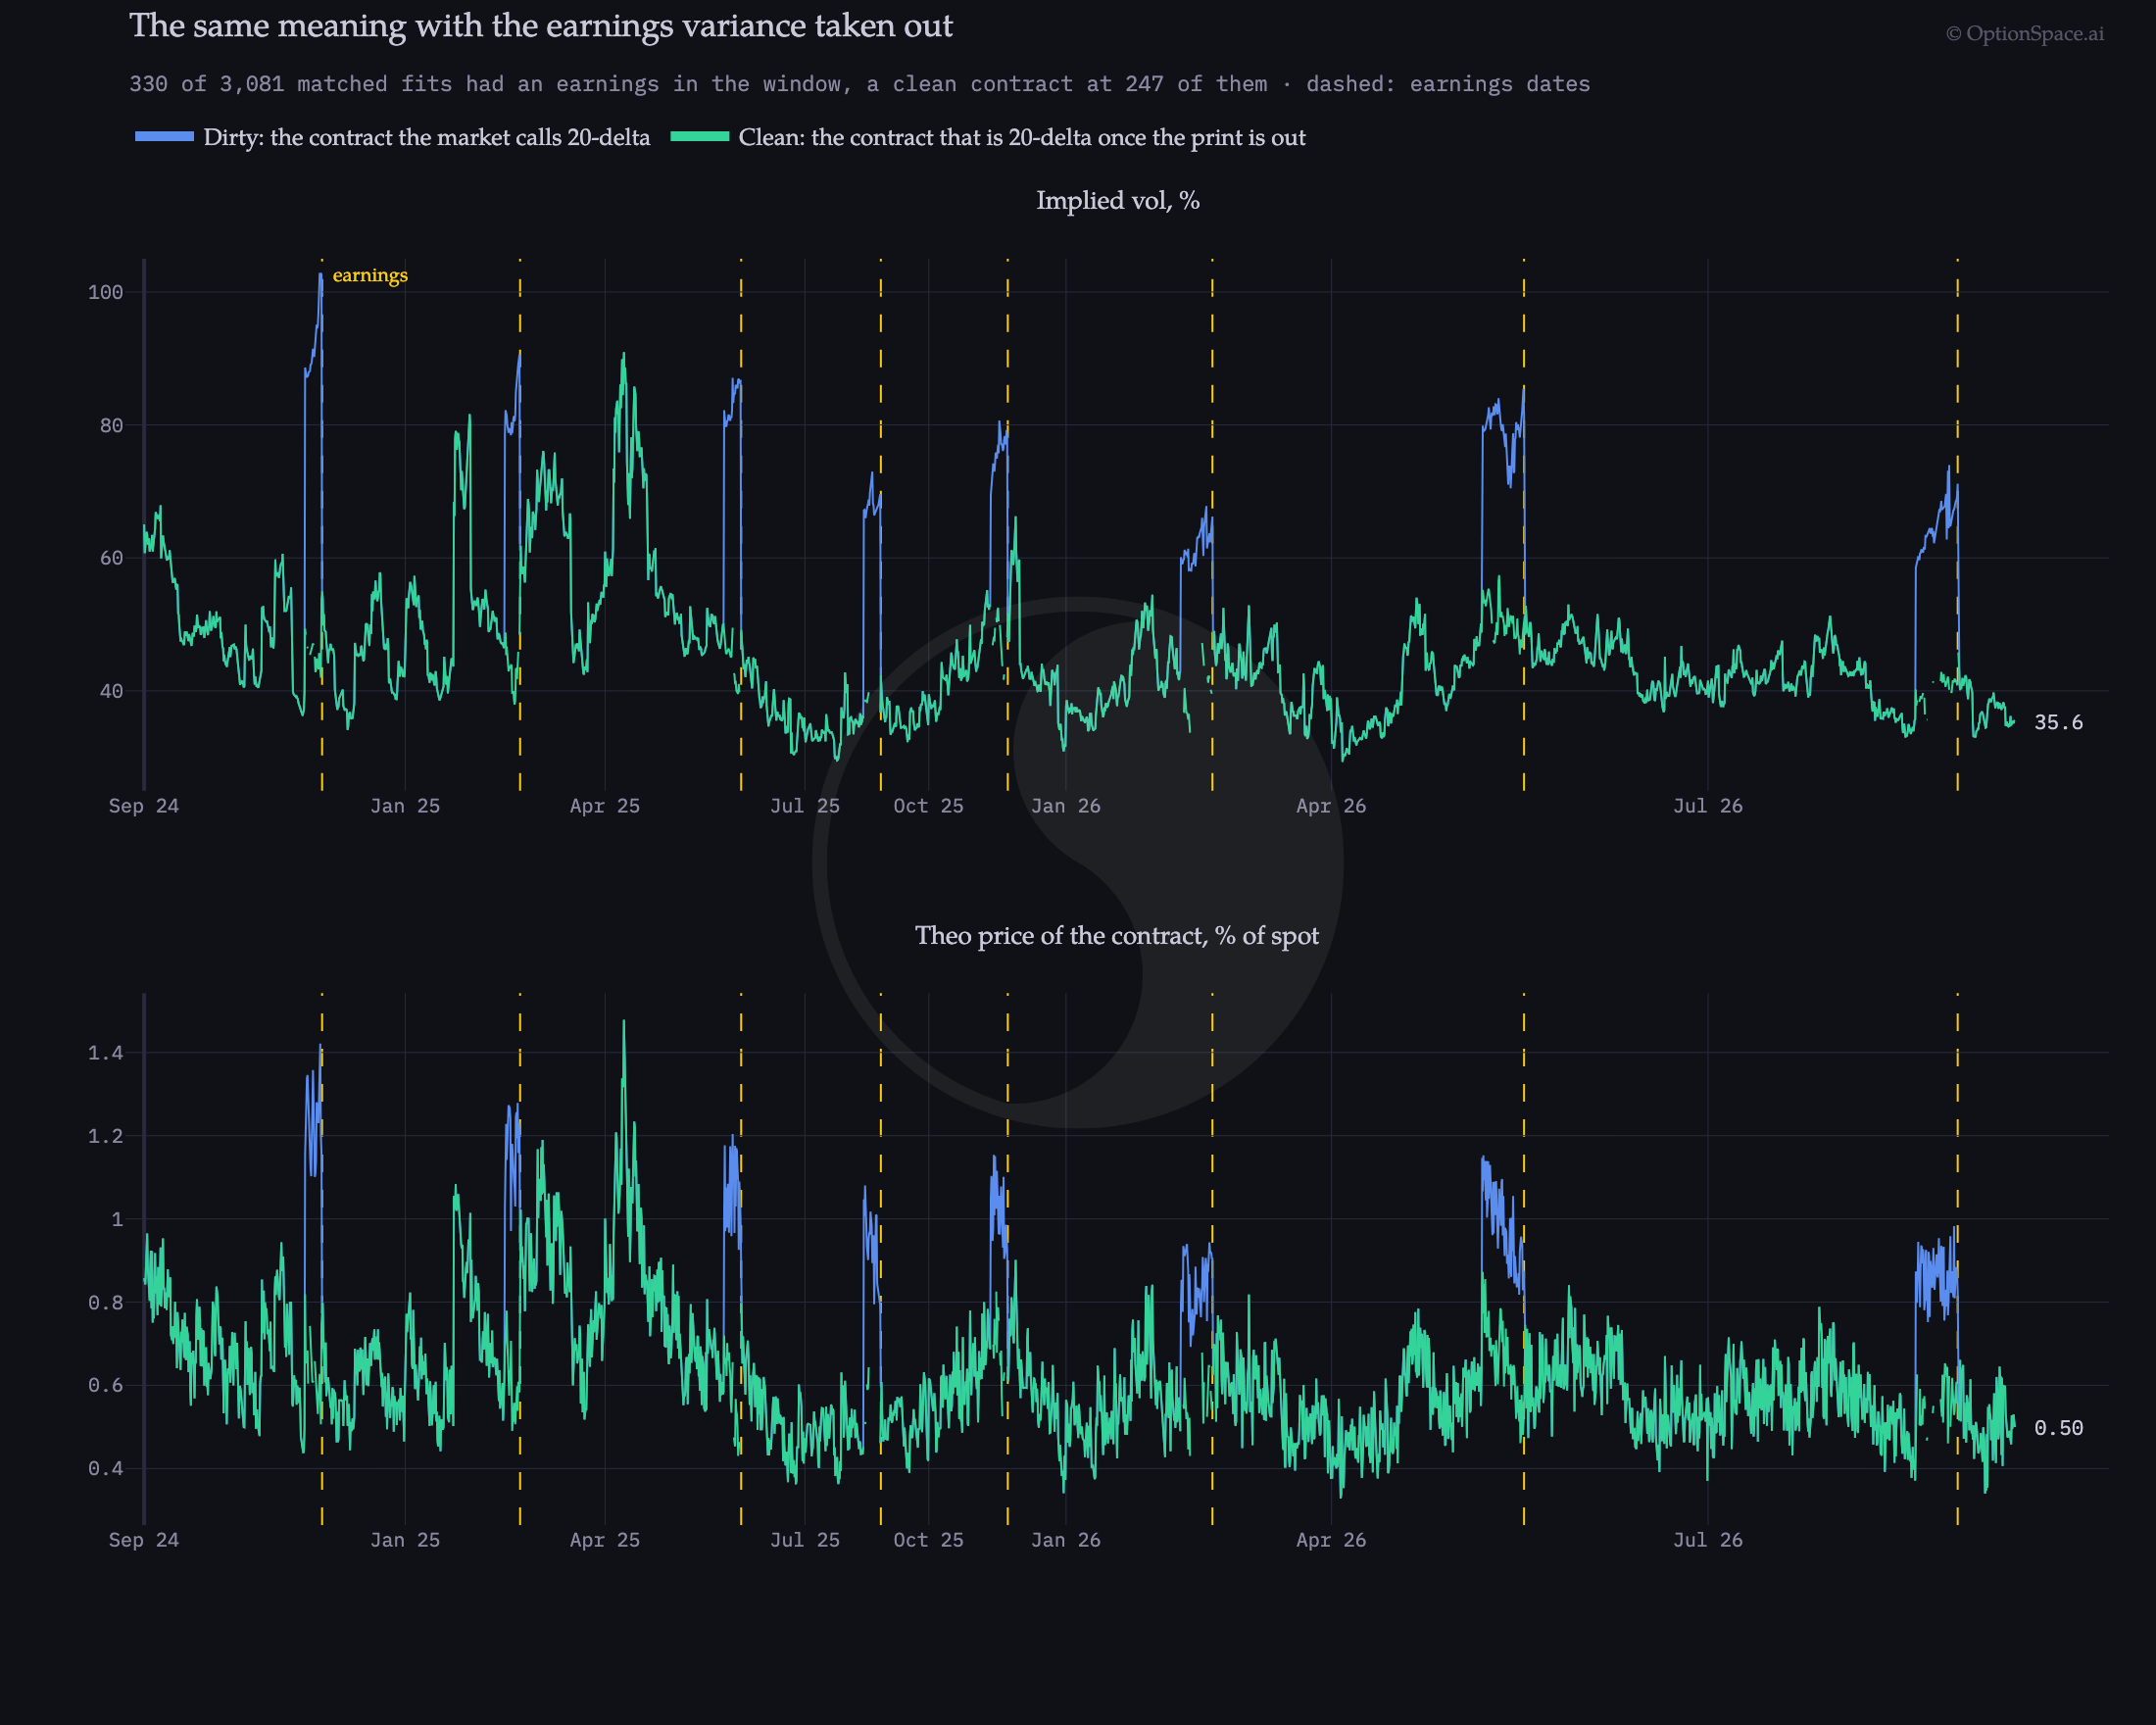
Two hundred and forty-seven fits change, 83 map to nothing, and the other 2,751 do not change. At 15:32 on 15 November 2024, with NVDA at $142 and a report five days away, the market’s 20-delta weekly call was the $160 strike at 103 percent vol, worth 1.20 percent of spot. Take the print out and that $160 strike is a 5-delta option; the contract that is 20-delta without the print is the $149 strike, at 42 percent vol and 0.51 percent of spot. In the dirty world the $149 strike was a 38-delta option. That is the whole argument of this post in one row: the meaning has to be re-found in the world you are pricing in, and it maps to a different instrument there.
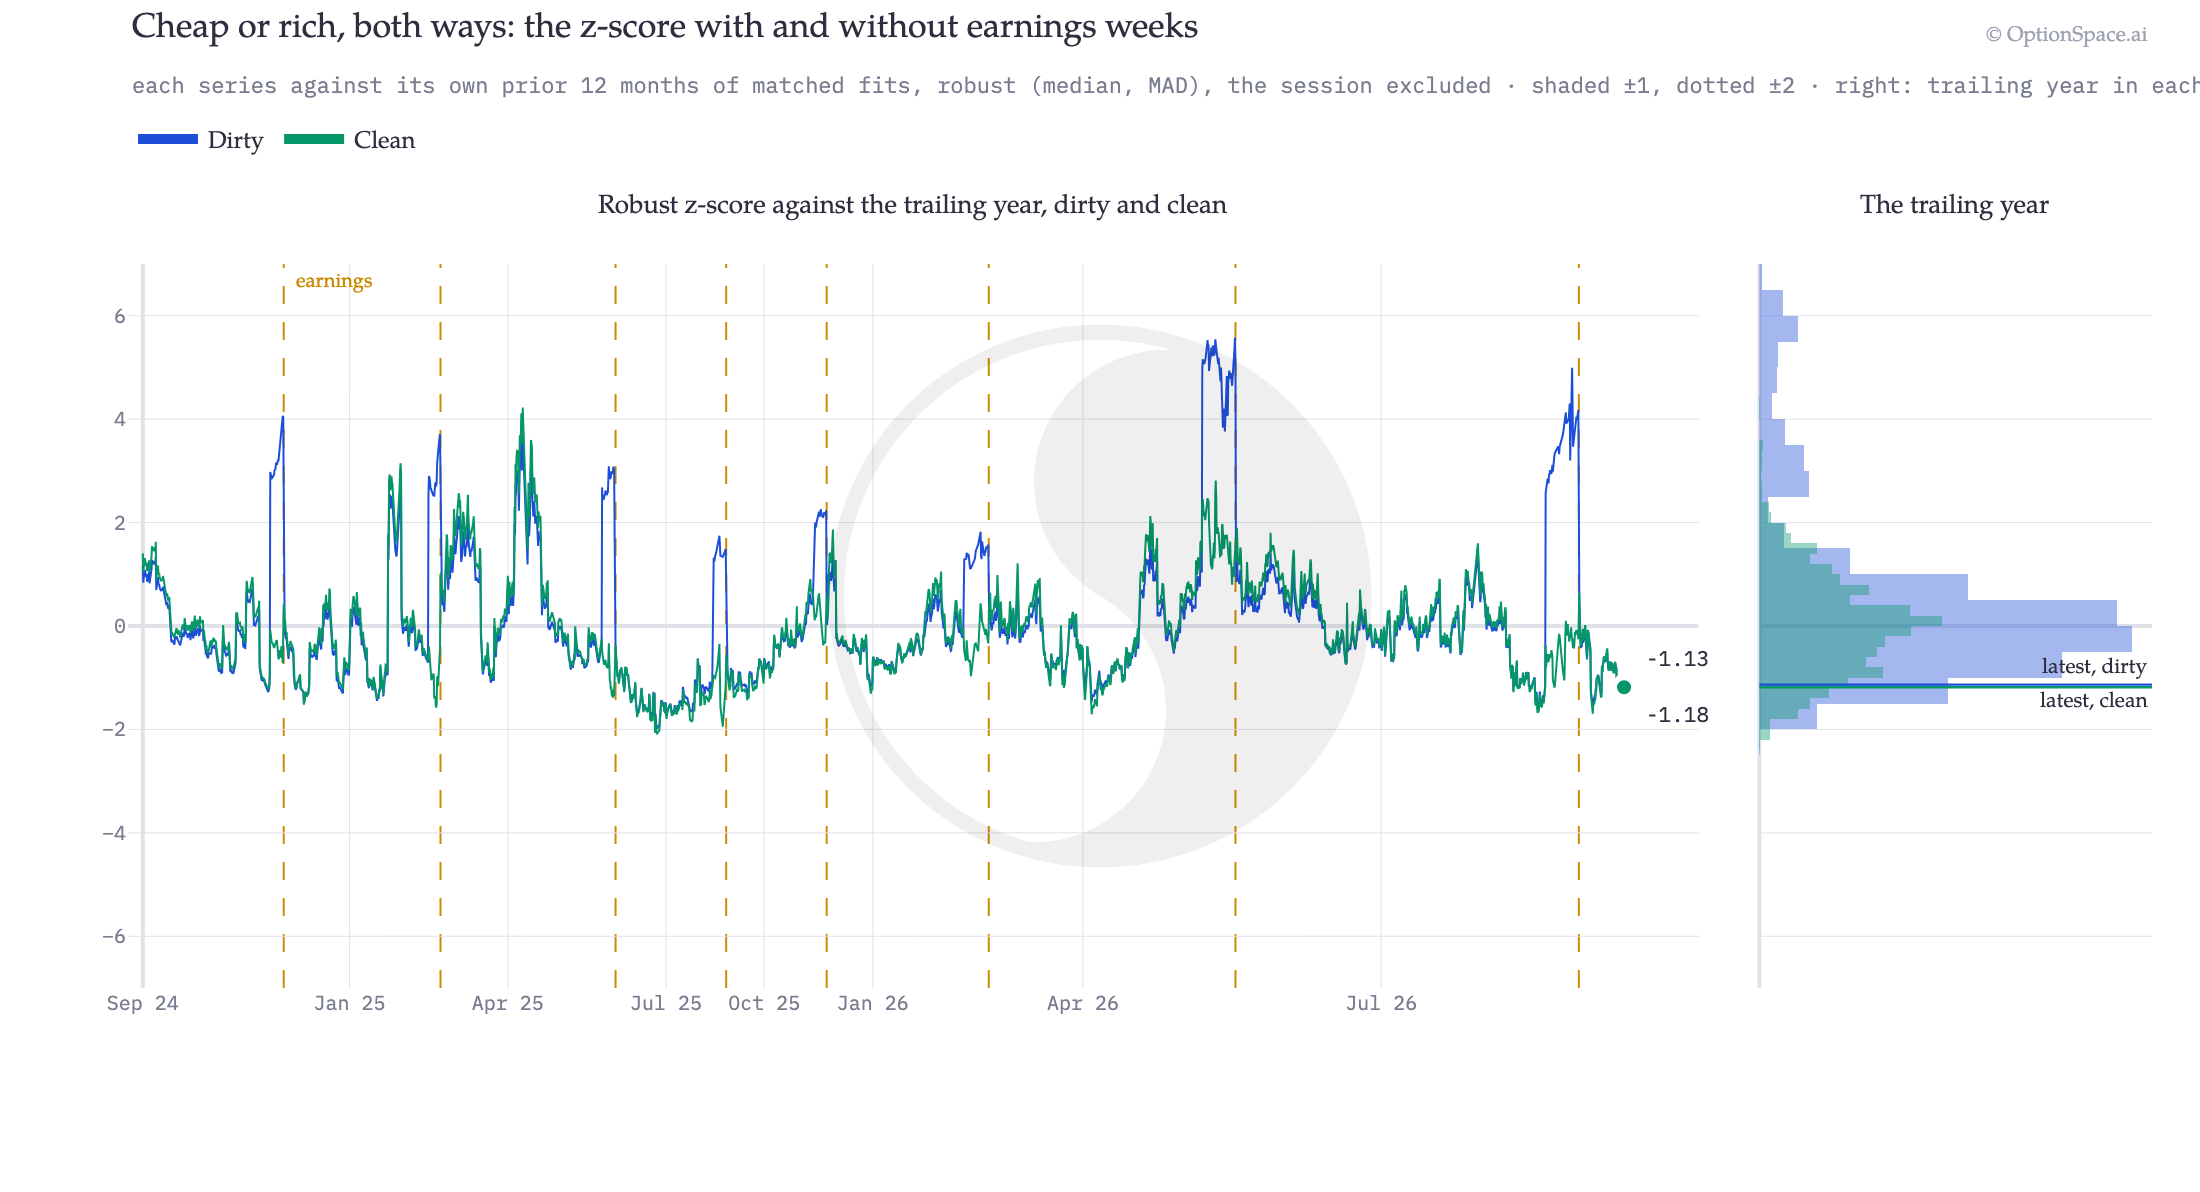
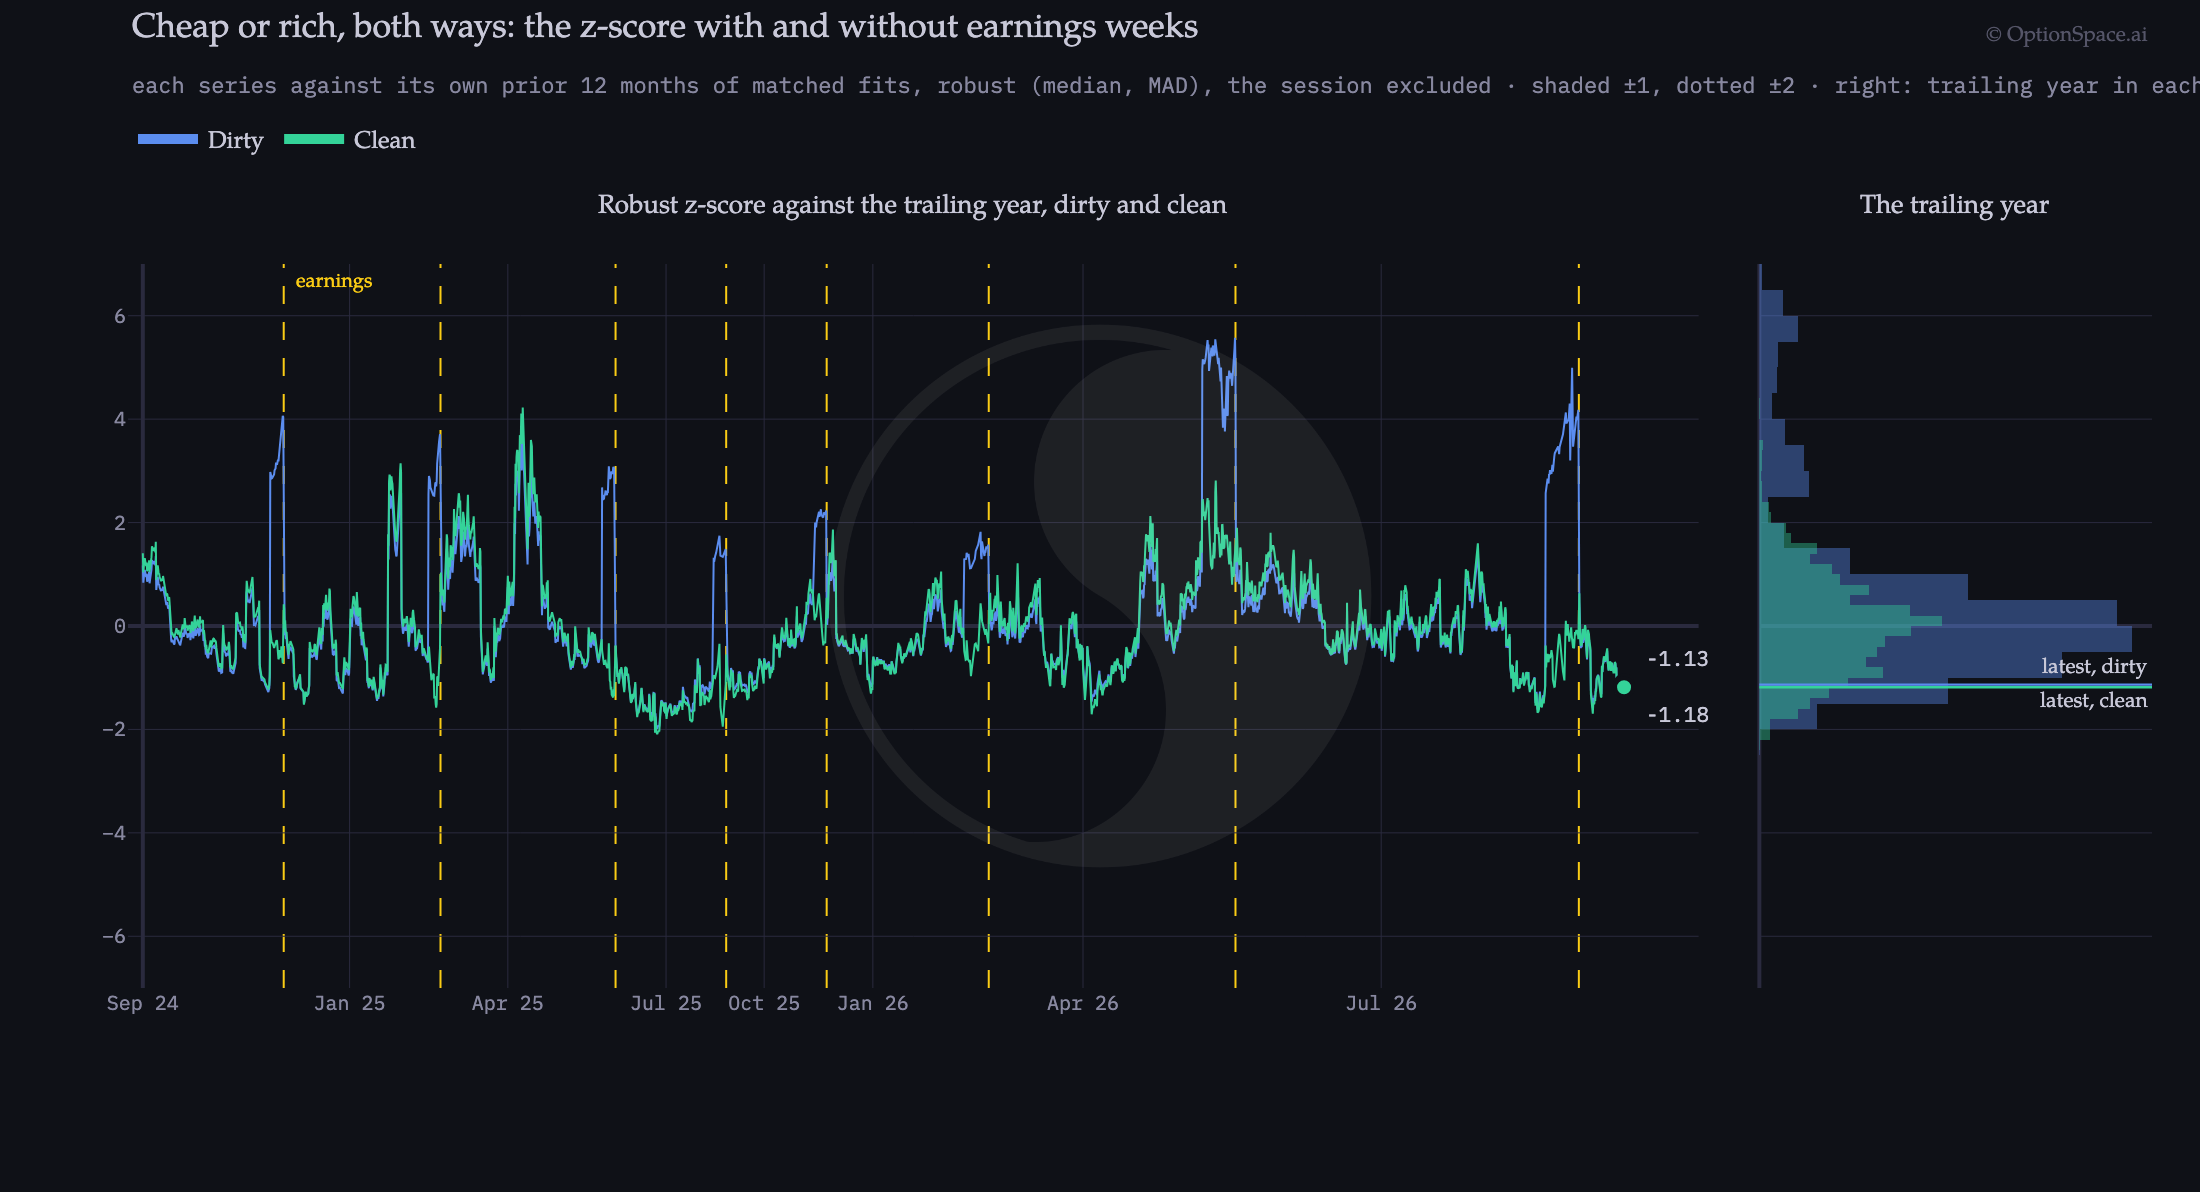
Same price, different answer. There is no earnings report inside the contract’s life on 14 September, so the clean meaning is the dirty meaning, 35.6 percent. What changes is the reference. The clean year has a median of 42.1 percent and a robust spread of 5.5 points, against 42.7 and 6.3 dirty, so the same 35.6 sits 1.2 robust standard deviations below the median of comparable weeks rather than 1.1. A robust statistic already resists the four reports a year; taking them out moves the answer a little further and, more to the point, makes the earnings weeks themselves comparable to the rest. If the question is whether a quiet week’s vol is cheap, ask it of the clean series. If the week has an earnings report in it, you can ask both: how is the clean series priced, and how is the event-only series priced.
The event-only series is not the same meaning-space trade. It is a side product of the analysis we were doing, and of the last question we asked. At every fit where the print sat inside the contract’s window, the decomposition that cleaned the series also says how much variance it attributed to the report. Here it is per print, as a one-standard-deviation move, next to the move that followed:
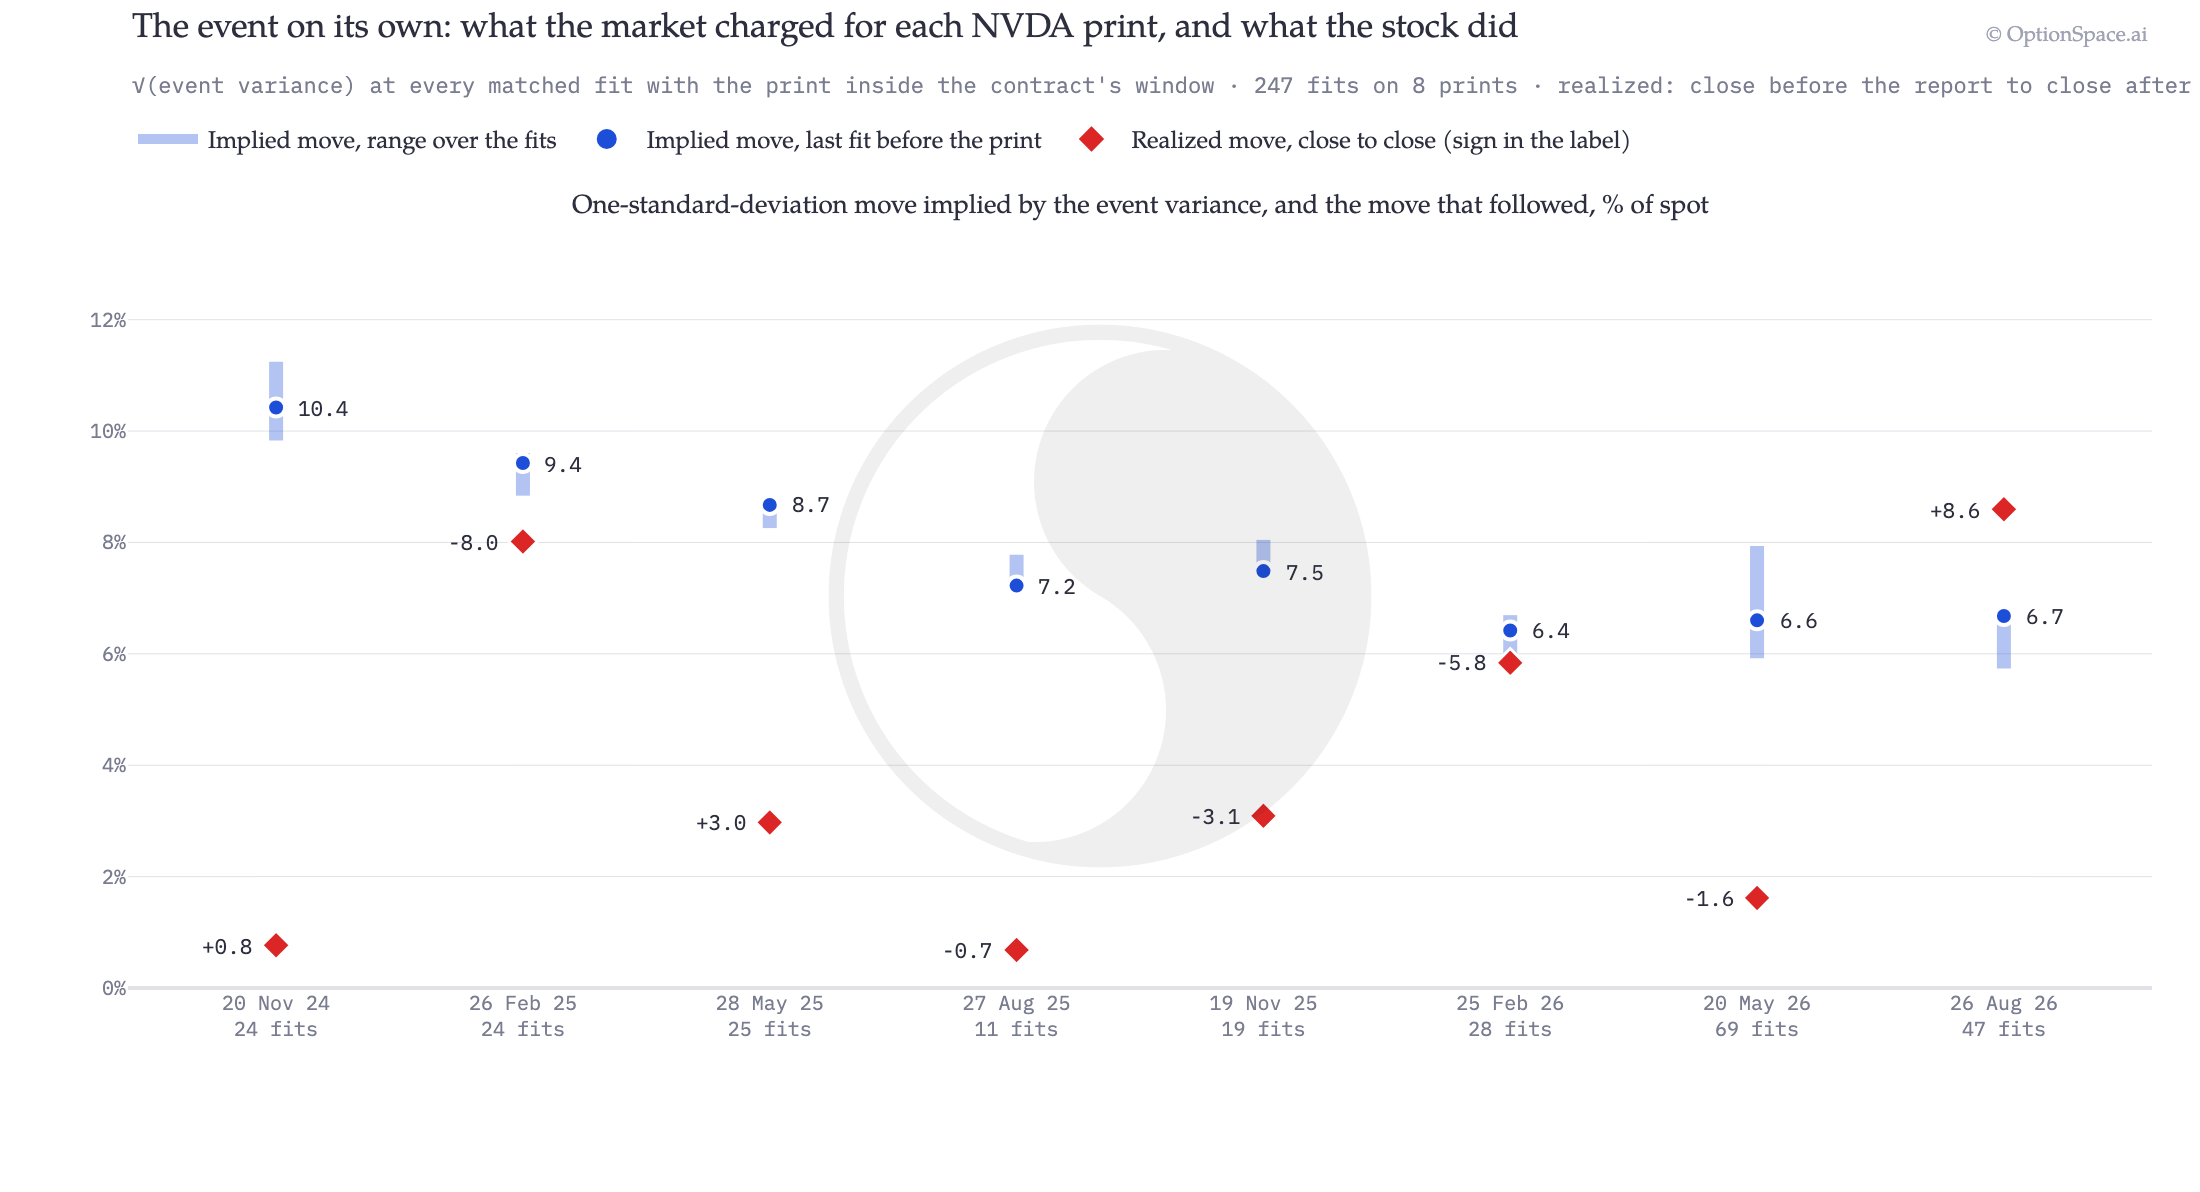
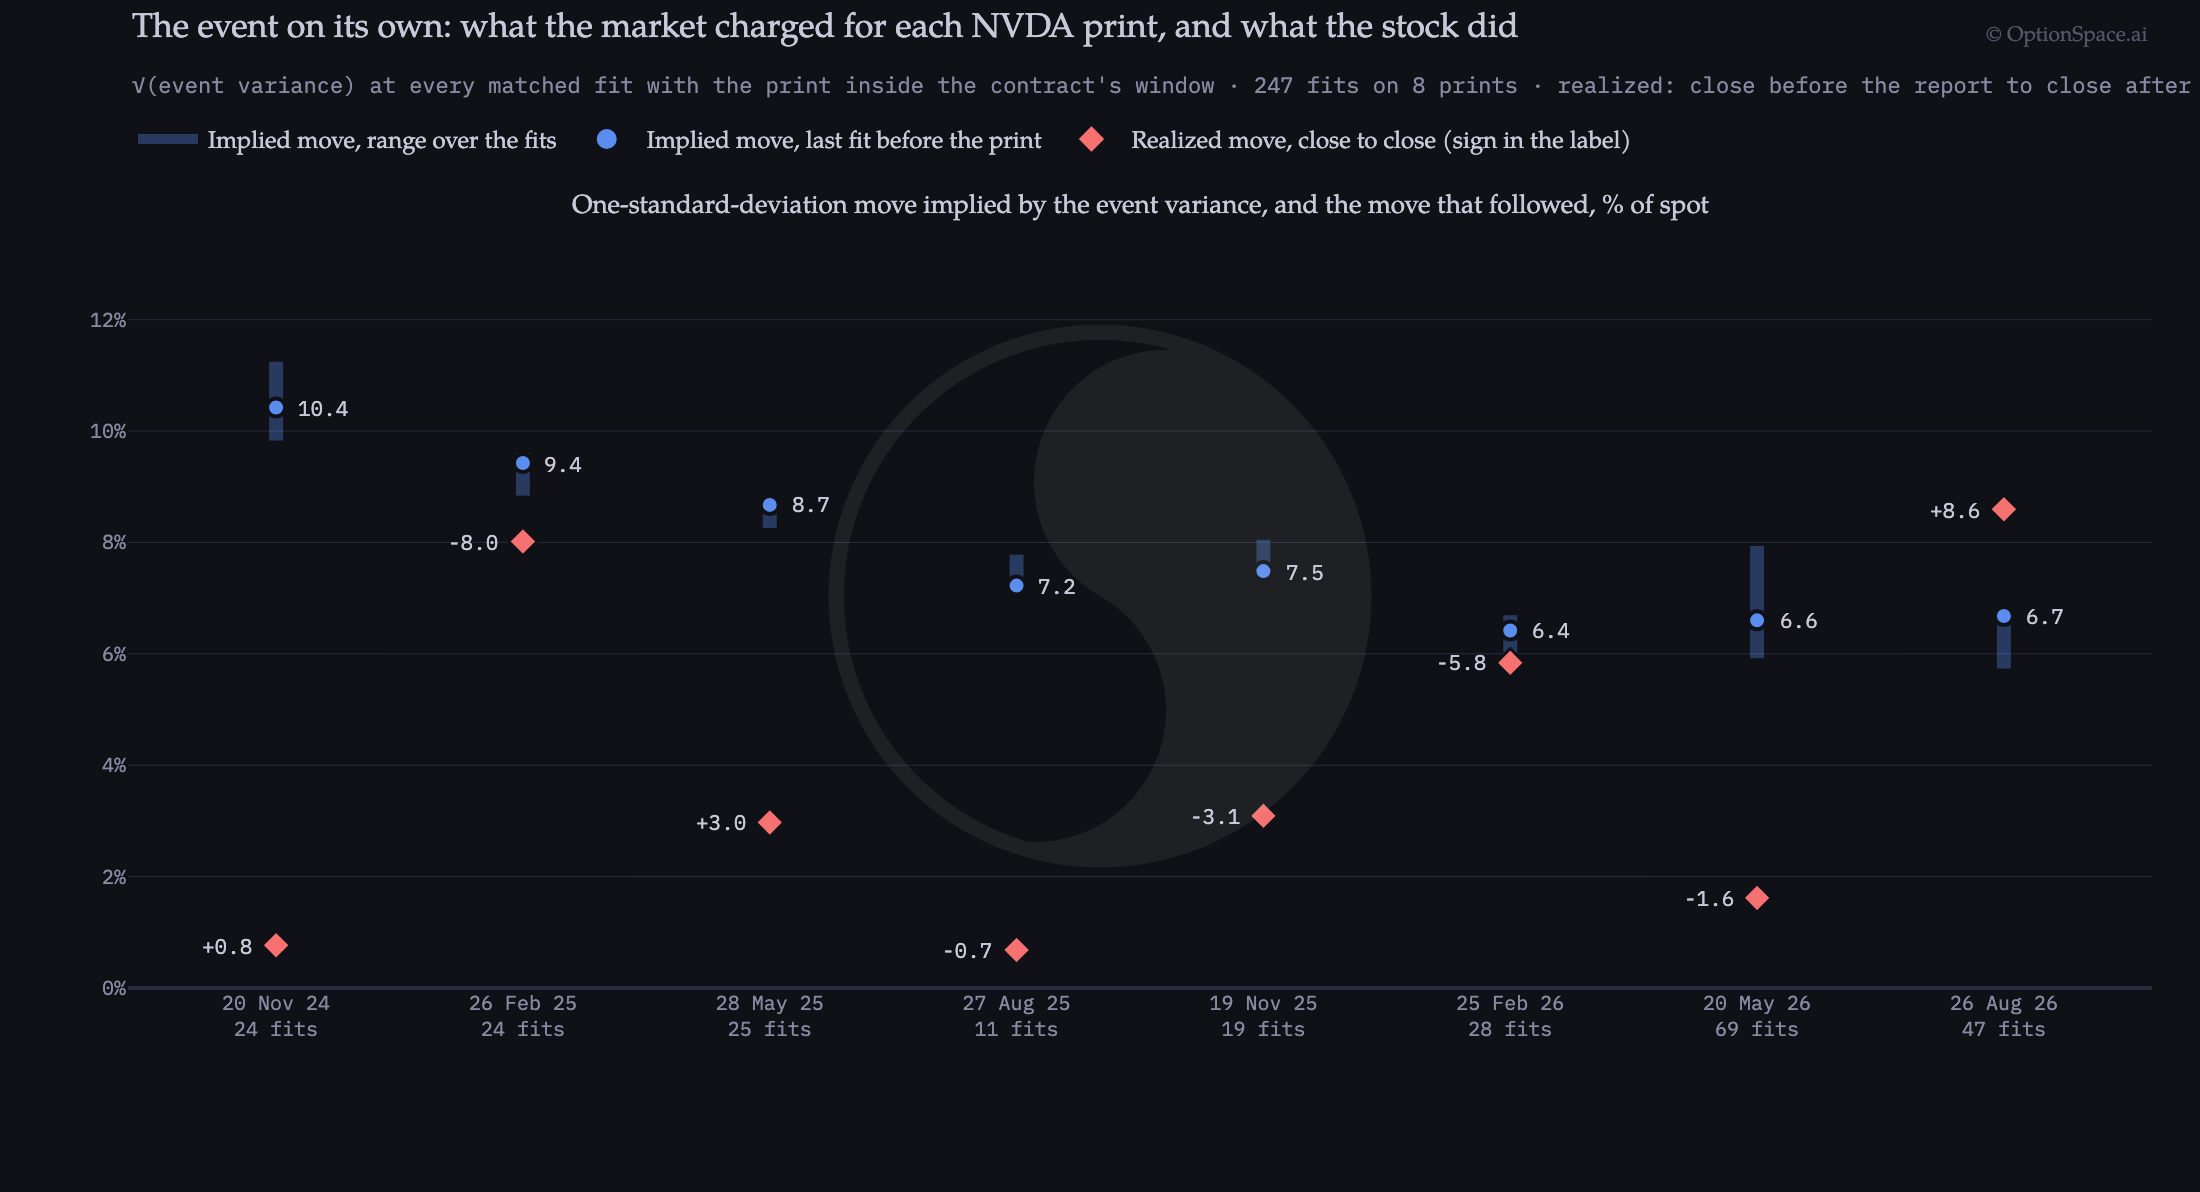
Another trade, already broken down. In case you have an opinion on the earnings vol priced in the options, that is another trade to investigate. OptionSpace breaks it down for you already.
End notes
- This analysis is not complete by any means. We only isolated a clean historical time series in ‘meaning space’. That gives us a way to say whether the price now is high or low, similar to looking at a price time series for a stock and seeing if the current price sits near the 52-week low or high.
- Another aspect that we did not look at here is how the rest of the options market looks during this time frame, and how do we compare relatively.
We give you the highest quality data and tools that you can buy, so you can ask the right questions, and think in OptionSpace.
DataOptionSpace fitted surfaces for NVDA, from the production volatility database: every half-hour fit and the close of every session from 3 September 2024 to 11 September 2026, 7,126 fits on 508 sessions, plus the 14 September live fits thinned to the same half-hour cadence; the year before is used only to seed the rolling statistics. Event variance comes from the production implied-event-variance tables, per fit for intraday snapshots and per session for the close. The realized moves in Fig. 07 use the close fits’ underlying price from the same database.
NoteFor educational purposes only. Nothing here is investment advice or a recommendation; the example illustrates a research workflow.