Base layer
for vol research.
Fast column-based DB backbone accessible via API, Python, MCP or visualization toolset.
Fitted vol surfaces, implied rates, and event analytics, built to the standard of a market-making desk. Vols and greeks you can trust.
Coverage varies by instrument and dataset.
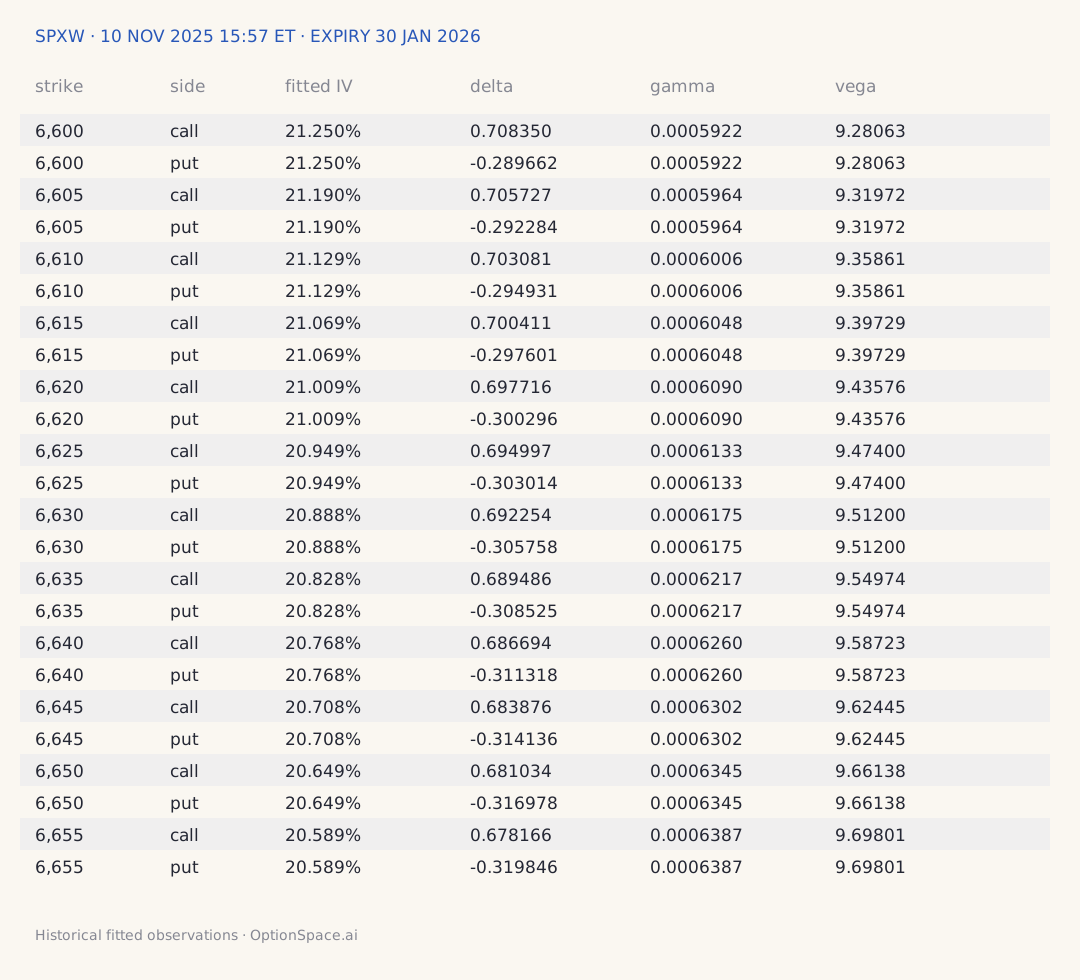
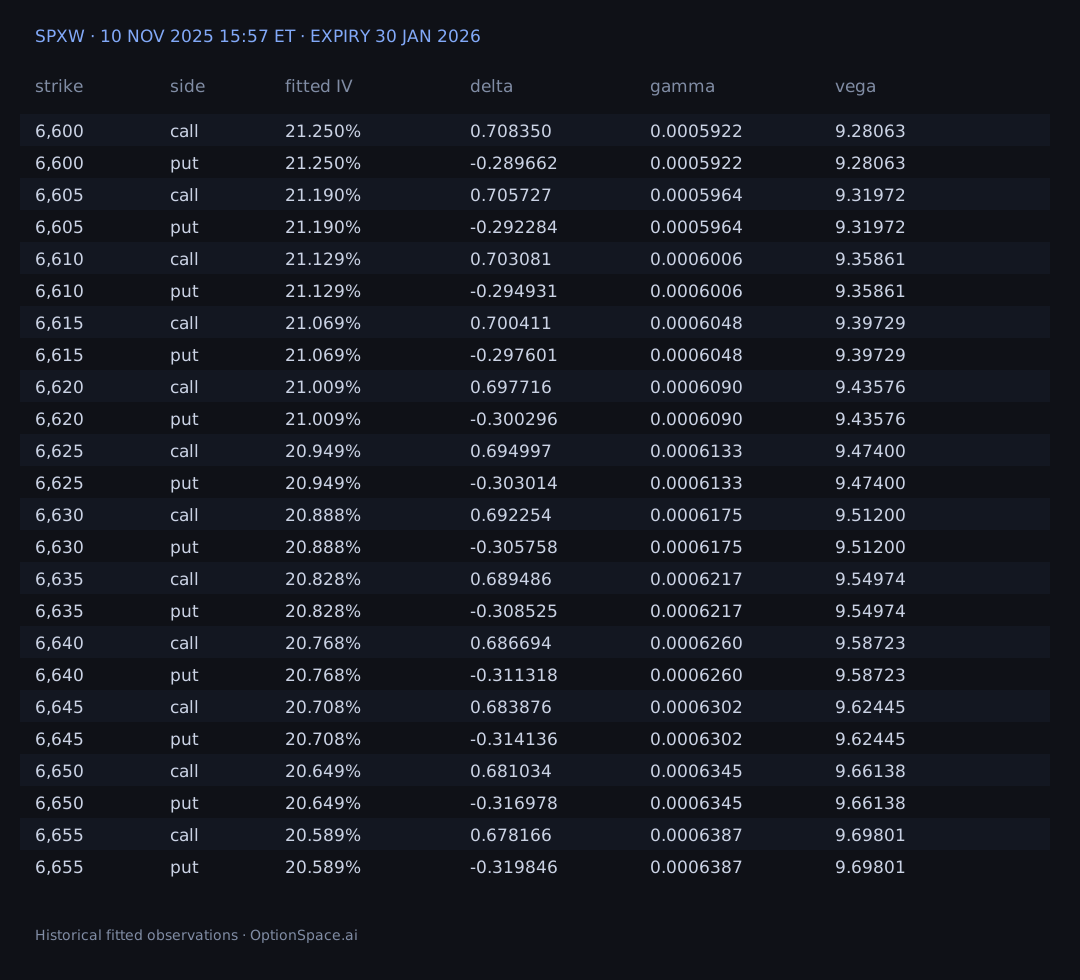
Six datasets.
Explore the datasets and their coverage. Open the full data catalog →
Volatility is inferred.
The model matters.
The same option quotes can imply different volatility under different pricing assumptions. OptionSpace models American exercise, discrete dividends, implied forwards and the relevant time conventions before fitting the surface.
Evaluate that work visually. Compare the fit with the quote bands, examine the wings, and inspect the methodology behind the numbers.
Sign-in required.
See the tools do the work.
Compare markets, separate event risk and test an idea. Each example pairs the tools with their research output.
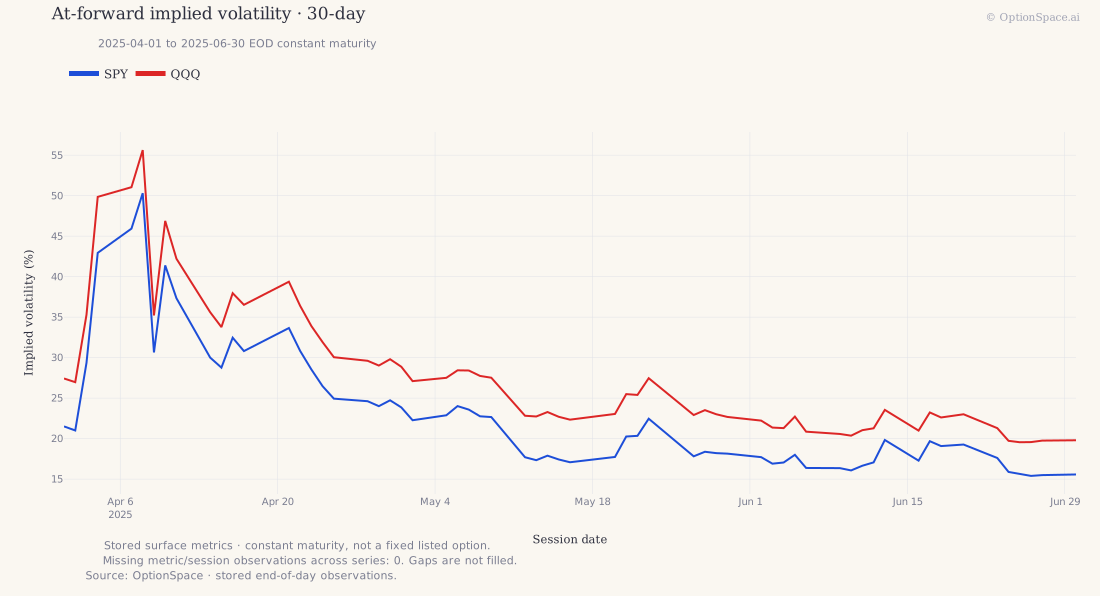
How did SPY and QQQ volatility and skew compare?
30-day constant maturity · April to June 2025 · daily closing observations
What did the market price for NVDA’s last eight earnings, and what happened?
An ordinary question in Claude Code, answered with OptionSpace’s earnings tools.
Use the same tools in Python
import optionspace as osp
from optionspace import charts
client = osp.Client()

earnings = client.earnings_history(
    "NVDA", "2026-09-16", count=8, granularity="5m"
)
charts.earnings_comparison_chart(earnings).show()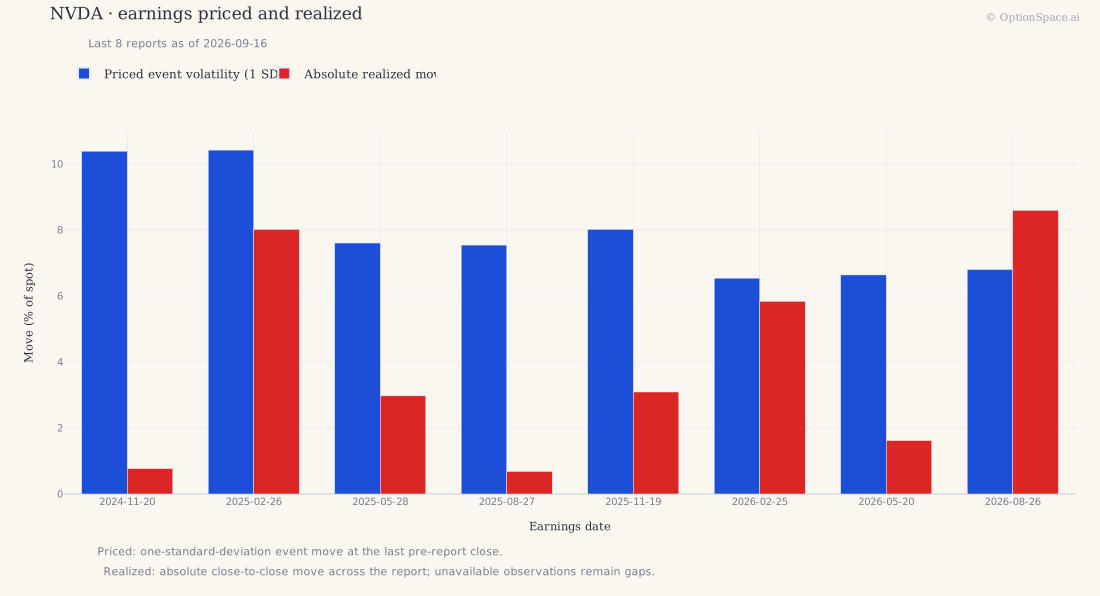
How much of NVDA volatility is the event?
Compare 30-day ATM volatility with and without the estimated event contribution.
Use the same tools in Python
import optionspace as osp
from optionspace import charts
client = osp.Client()

history = client.clean_atm_history(
    "NVDA", "2024-01-02", "2026-09-16", tenor_days=30, granularity="5m"
)
charts.clean_atm_chart(history).show()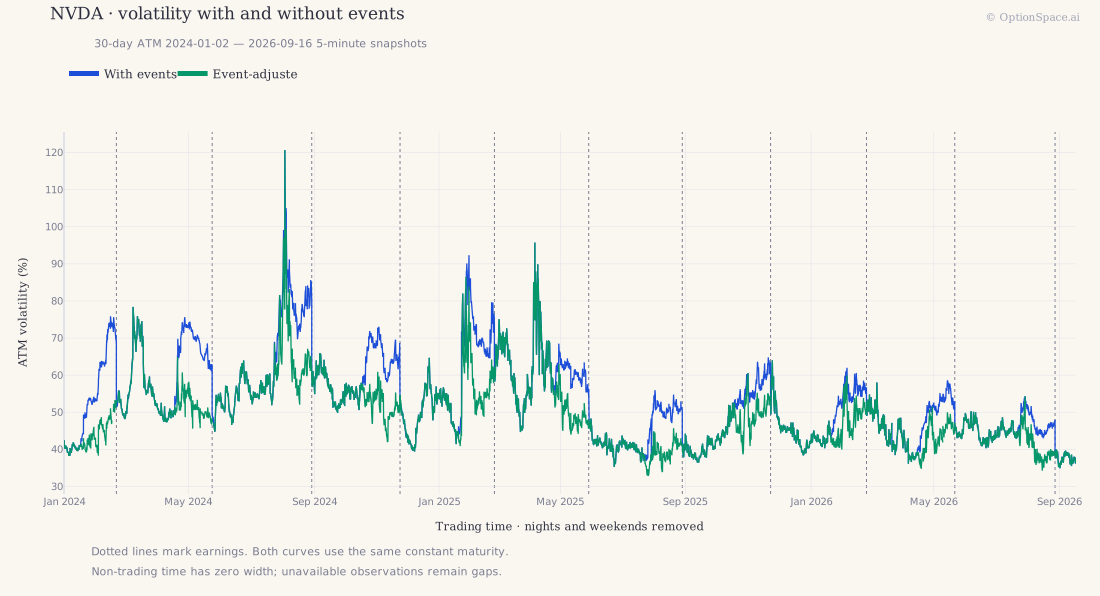
How did expectations evolve before each report?
Align eight NVDA earnings run-ups on the same trading-session timeline.
Use the same tools in Python
import optionspace as osp
from optionspace import charts
client = osp.Client()

earnings = client.earnings_history(
    "NVDA", "2026-09-16", count=8, granularity="5m"
)
charts.earnings_runup_chart(earnings).show()
What happens between entering and closing an earnings trade?
Simulate put credit spreads across eight NVDA reports, then inspect one position minute by minute.
Use the same tools in Python
import optionspace as osp
from optionspace import charts
client = osp.Client()

test = client.earnings_backtest(
    "NVDA", "2026-09-16", count=8,
    entry_offset=-5, exit_offset=1,
    fill_model="quote_side", fee_per_contract=0.65, granularity="1m"
)
charts.earnings_backtest_chart(test).show()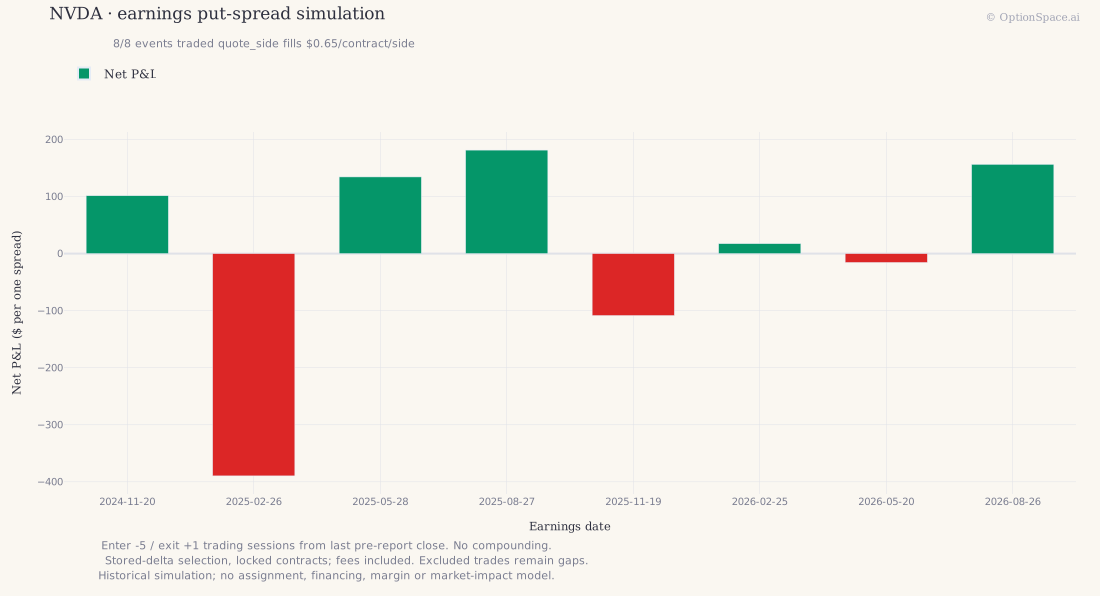
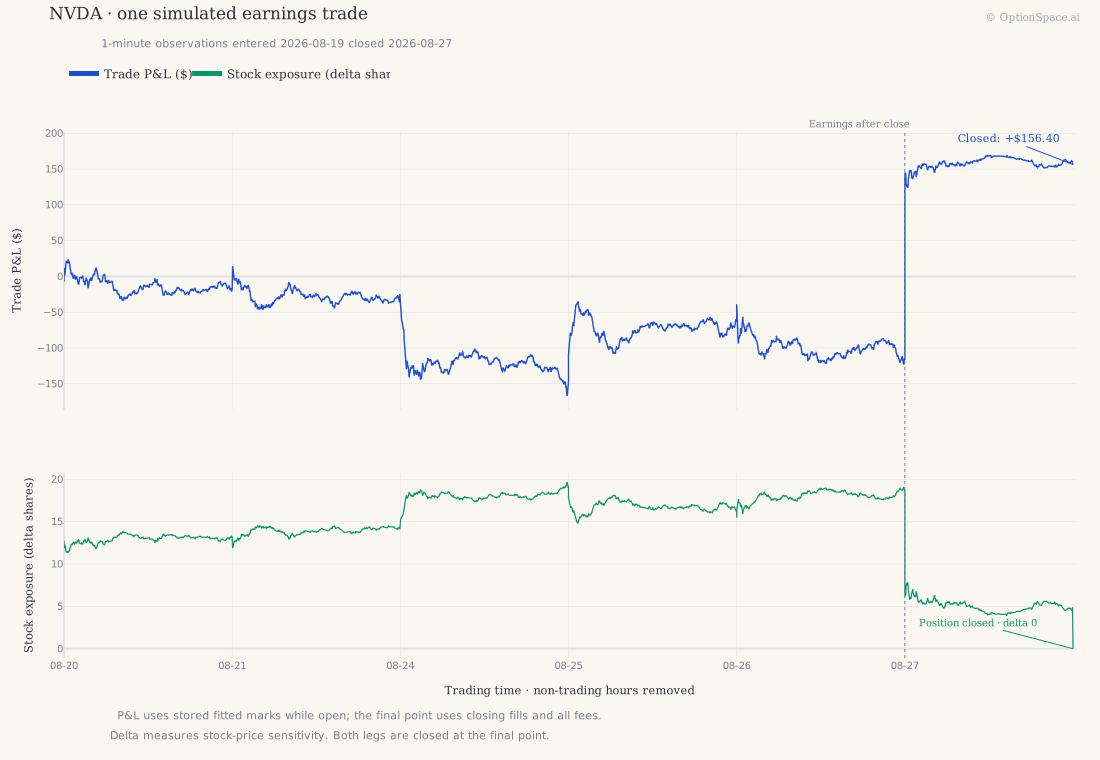
Follow the last trade: one-minute P&L and delta ↗
Sell one NVDA $200 put and buy one $185 put, both expiring 18 September 2026. Enter 19 August; close 27 August after earnings. The top panel tracks marked P&L, the bottom panel tracks stock-price exposure. The final point includes closing fills and all fees.
Recorded research examples and Opus 5 responses. Code replays are illustrative. Explore each chart independently; no live queries run in this page.
Sign up to get updates
about our launch.
Or reach us at [email protected] for a conversation about your needs.